
Figures & data
Table 1. Genome assembly statistics of Gloeostereum incarnatum strain GiC-126.
Figure 1. Genome annotations of Gloeostereum incarnatum strains GiC-126 and CCMJ2665.
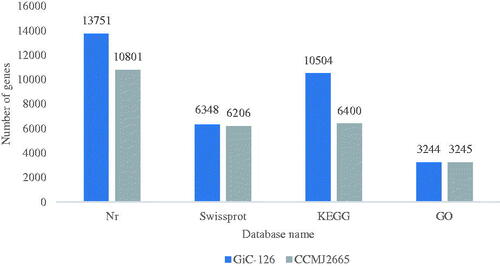
Table 2. Genomic characteristics of Gloeostereum incarnatum strains GiC-126 and CCMJ2665.
Figure 2. Integration of the Gloeostereum incarnatum genome assembly sequence based on genetic linkage map. Left, CCMJ2665 genome assembly sequence (SCAFFOLD) and length (kb); right, GiC-126 genome assembly sequence (scaffold) and length (kb). Number indicated the lengths of the scaffolds (kb). Red numbers and lines indicate the scaffold sequences where an anchoring problem occurred.
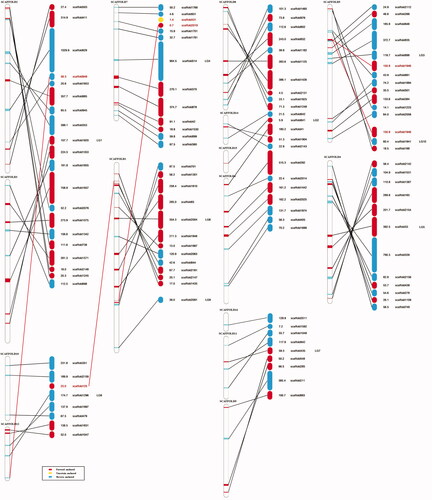
Table 3. Integration of the genome assembly sequences of Gloeostereum incarnatum strains GiC-126 and CCMJ2665.
Table 4. Composition and number of SSR loci in the Gloeostereum incarnatum genome assembly sequence.
Figure 3. Size distribution of SSR loci in the Gloeostereum incarnatum genome assembly sequence.
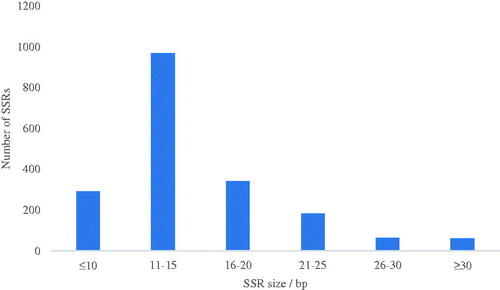
Figure 4. Electrophoresis of 51 pairs of SSR primers ≥ 30bp.
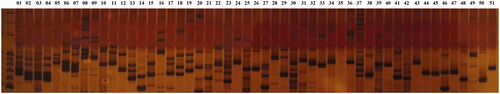
Figure 5. Gene ontology (GO) classification of SSR-containing genes in the Gloeostereum incarnatum genome assembly sequence.
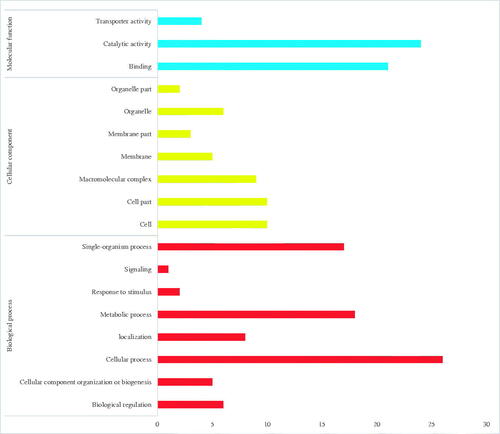
Figure 6. KEGG classification of SSR-containing genes in the Gloeostereum incarnatum genome assembly sequence.
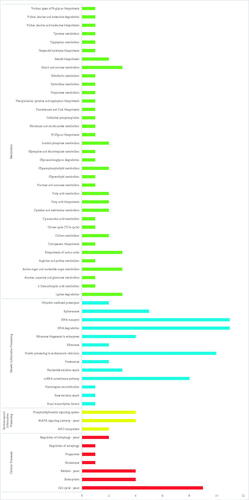
Figure 7. Electrophoresis of 25 pairs of SSR primers related to metabolism.
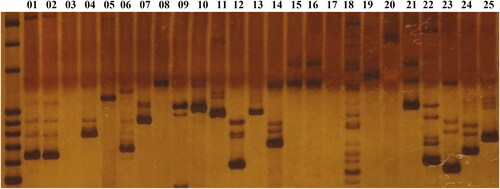
Table 5. Numbers of CAZymes in the two Gloeostereum incarnatum genomes compared with those in other fungi genomes.
Figure 8. Linkage group of the segregation distortion site. (A) Linkage group with the MAT-A locus. (B) Linkage group before the addition of the MAT-A locus. (C) Linkage group of the segregation distortion site (except LG1).
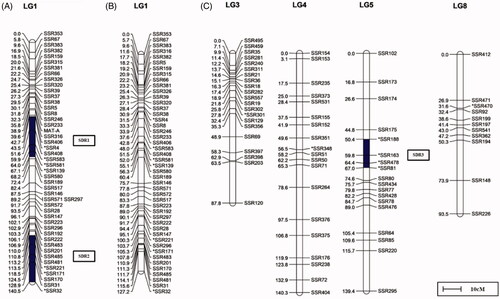
Table 6. Segregation distortion sites of SSRs in the Gloeostereum incarnatum linkage map after adding the MAT-A locus.
Figure 9. Structure of the MAT-A in the GiC-126 genome. (A) Structure of MAT-A. (B) Structures of the mip and beta-fg genes in MAT-A.
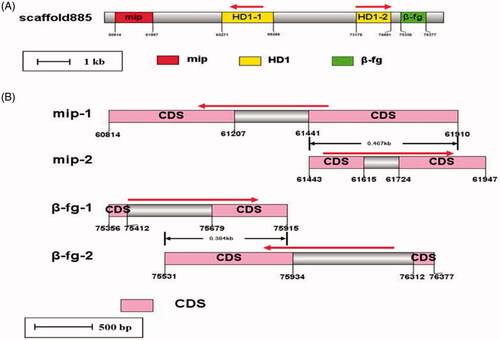
Table 7. Genes in the MAT-A in the Gloeostereum incarnatum genome assembly sequence.