Figures & data
Table 1. Taxa used in the phylogenetic analyses and the new taxa in bold.
Figure 1. Phylogenetic relationships of Phallus spp. inferred from ITS sequences. Numbers at the significant nodes represent ML bootstrap values/MP/Bayesian posterior probabilities, multiplied by 100; bold lines in the tree represent 100% bootstrap (BSMP, BSML) and 1.00 posterior probability (BPP).
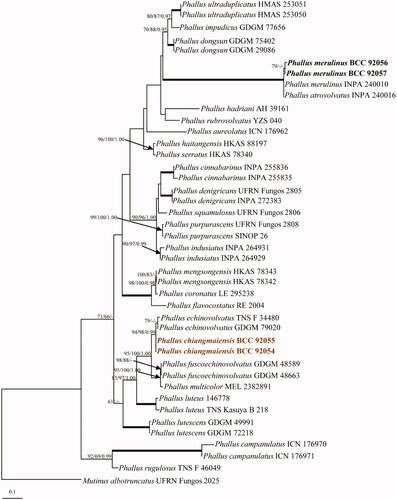
Figure 2. Phylogenetic relationships of Phallus spp. from a combined ITS, LSU, and atp6 analyses. Numbers at the significant nodes represent ML bootstrap values/MP/Bayesian posterior probabilities, multiplied by 100; bold lines in the tree represent 100% bootstrap (BSMP, BSML) and 1.00 posterior probability (BPP).
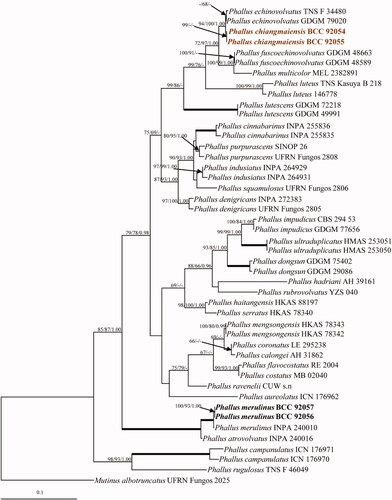
Figure 3. Phallus chiangmaiensis (BBH 47825, holotype). (a) Mature basidiomata. (b) Reticulate cap. (c) Indusium. (d) Immature basidiomata (egg). (e) Pseudostipe and section of immature basidiomata. Scale bars: a = 50 mm, b–e = 10 mm.
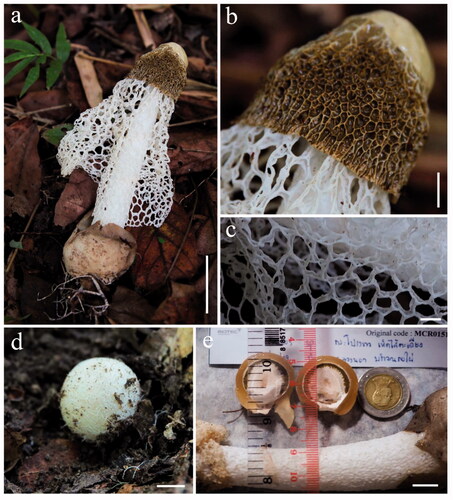
Figure 4. Microscopic features of Phallus chiangmaiensis. (a,b) Cap cells and hyphae. (c) Cells of indusium. (d) Cells of pseudostipe. (e) Crystals in volva hyphae (arrowed). (f,g) Volva hyphae with clamp connections (arrowed). (h,i) Rhizomorph hyphae with clamp connections (arrowed). (j) Basidia with sterigmata and basidiospores. (k) Basidiospores. (l) Colony on PDA (surface and reverse plate). Scale bars: a, c–e = 20 µm, b, f–j = 10 µm, g, k = 5 µm, l = 10 mm.
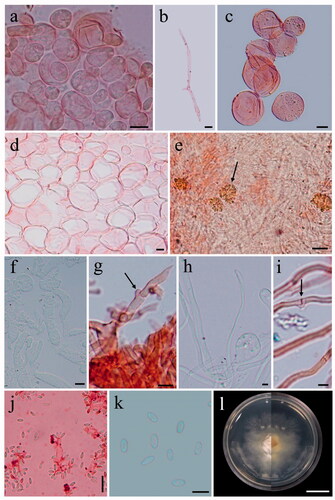
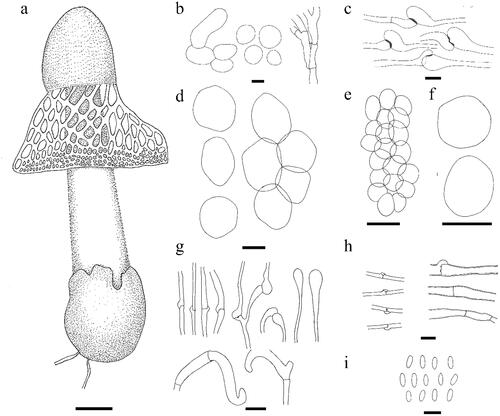
Figure 5. Line drawing of Phallus chiangmaiensis. (a) Fruiting body. (b) Cells of indusium. (c,d) Cells of pseudostipe. (e) Volva hyphae. (f) Rhizomorph hyphae. (g) Basidia. (h) Basidiospores. Scale bars: a = 50 mm, b–d = 50 μm, e = 10 μm, f = 20 μm, g–h = 5 μm.
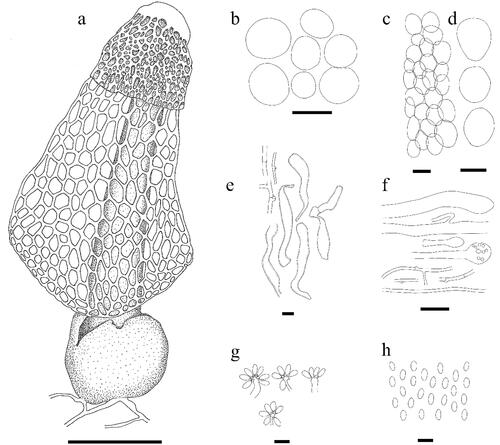
Table 2. Synopsis of macro- and micro- characteristics of Phallus chiangmaiensis, P. echinovolvatus, P. fuscoechinovolvatus, P. lutescens, P. luteus, and P. multicolor.
Figure 6. Phallus merulinus (BBH 47826). (a,b) Basidiomata. (c,d) Immature basidiomata (eggs) with rhizomorph (arrowed). (e) Indusium and pseudostipe. (f) Volva. Scale bars: a–b = 50 mm, c–f = 20 mm.
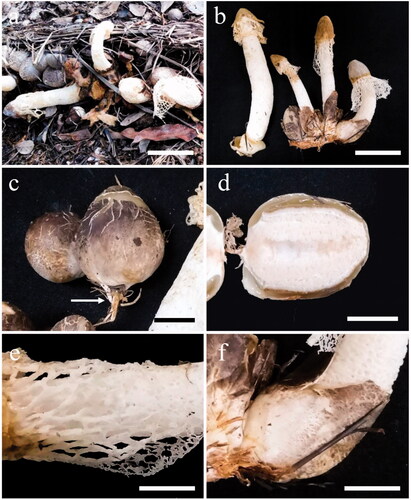
Figure 7. Microscopic features of Phallus merulinus. (a–e) Cap cells and hyphae. (f) Cells of indusium. (g) Cells of pseudostipe. (h,i) Volva hyphae. (j,k) Rhizomorph hyphae. (l) Basidiospores. (m) Colony on PDA (surface and reverse plate). Scale bars: a–b, f–g = 20 µm, c–e, h–l = 5 µm, m = 20 mm.
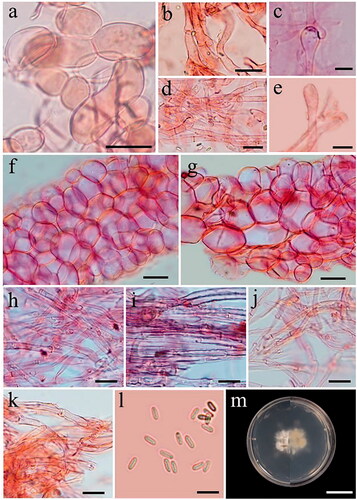
Figure 8. Line drawing of Phallus merulinus. (a) Fruiting body. (b,c) Cap cells and hyphae. (d) Cells of indusium. (e,f). Cells of pseudostipe. (g) Volva hyphae. (h) Rhizomorph hyphae. (i) Basidiospores. Scale bars: a = 20 mm, b, g = 10 μm, c, h, i = 5 μm, d = 20 μm, e–f = 50 μm.