Figures & data
Figure 1. Sampling positions at Nha Trang Bay and Van Phong Bay of Khanh Hoa Province, Vietnam. Detail information on locations was given in the .
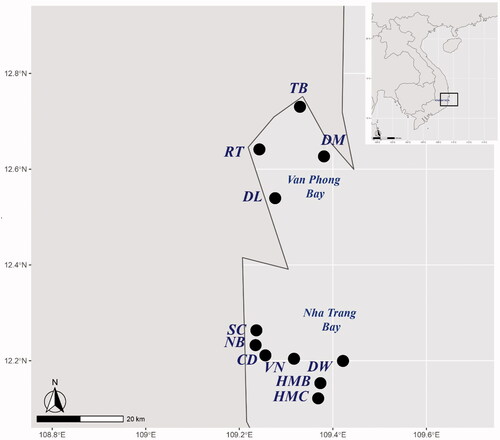
Table 1. Details regarding colony forming units (CFUs) of fungal colonies on the SDA medium plates and strains identified with ITS sequence.
Table 2. Taxonomy of cultured fungal species found in this study.
Table 3. Phylogenetic affiliation and taxonomy of the fungal OTUs obtained with ITS primers based on cultivated-independence studies.
Figure 2. The percentage abundance of major phyla of fungi isolates from all 11 samples using culture-dependent approach (A), fungi isolates from 3 samples HMC, CD and DW using culture-dependent approach (B), and fungal OTUs from 3 samples HMC, CD and DW using culture-independent approach (C).
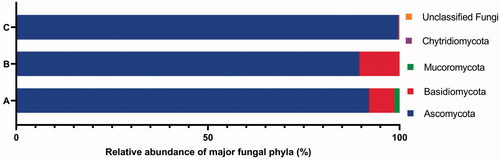
Figure 3. Phylogenetic tree of Orders Capnodiales, Dothideales and Pleosporales (class Dothideomycetes, Phylum Ascomycota) based on ITS rRNA genes. The evolutionary history was inferred by using the Maximum Likelihood method and Kimura 2-parameter model [Citation54]. The tree with the highest log likelihood –2876.51) is shown. The percentage of trees in which the associated taxa clustered together is shown next to the branches. Initial tree(s) for the heuristic search were obtained automatically by applying Neighbor-Join and BioNJ algorithms to a matrix of pairwise distances estimated using the Maximum Composite Likelihood (MCL) approach, and then selecting the topology with superior log likelihood value. The rate variation model allowed for some sites to be evolutionarily invariable ([+I], 34.52% sites). The tree is drawn to scale, with branch lengths measured in the number of substitutions per site. This analysis involved 18 nucleotide sequences, including ones in this study (*), from type strains (T) and Chytridium olla UACCC ARG100 (T) used as an outgroup.
![Figure 3. Phylogenetic tree of Orders Capnodiales, Dothideales and Pleosporales (class Dothideomycetes, Phylum Ascomycota) based on ITS rRNA genes. The evolutionary history was inferred by using the Maximum Likelihood method and Kimura 2-parameter model [Citation54]. The tree with the highest log likelihood –2876.51) is shown. The percentage of trees in which the associated taxa clustered together is shown next to the branches. Initial tree(s) for the heuristic search were obtained automatically by applying Neighbor-Join and BioNJ algorithms to a matrix of pairwise distances estimated using the Maximum Composite Likelihood (MCL) approach, and then selecting the topology with superior log likelihood value. The rate variation model allowed for some sites to be evolutionarily invariable ([+I], 34.52% sites). The tree is drawn to scale, with branch lengths measured in the number of substitutions per site. This analysis involved 18 nucleotide sequences, including ones in this study (*), from type strains (T) and Chytridium olla UACCC ARG100 (T) used as an outgroup.](/cms/asset/e10f4bfd-6b26-4274-8ce9-4164356bb59c/tmyb_a_2008103_f0003_b.jpg)
Figure 4. Phylogenetic tree of Orders Chaetothyriales and Eurotiales (Class Eurotiomycetes, Phylum Ascomycota) based on ITS rRNA genes. The evolutionary history was inferred by using the Maximum Likelihood method and Kimura 2-parameter model [Citation55]. The tree with the highest log likelihood (–3375.53) is shown. The percentage of trees in which the associated taxa clustered together is shown next to the branches. Initial tree(s) for the heuristic search were obtained automatically by applying Neighbor-Join and BioNJ algorithms to a matrix of pairwise distances estimated using the Maximum Composite Likelihood (MCL) approach, and then selecting the topology with superior log likelihood value. A discrete Gamma distribution was used to model evolutionary rate differences among sites (5 categories (+G, parameter = 0.3870)). The tree is drawn to scale, with branch lengths measured in the number of substitutions per site. This analysis involved 41 nucleotide sequences, including ones in this study (*), from type strains (T) and Chytridium olla UACCC ARG100 (T) used as an outgroup.
![Figure 4. Phylogenetic tree of Orders Chaetothyriales and Eurotiales (Class Eurotiomycetes, Phylum Ascomycota) based on ITS rRNA genes. The evolutionary history was inferred by using the Maximum Likelihood method and Kimura 2-parameter model [Citation55]. The tree with the highest log likelihood (–3375.53) is shown. The percentage of trees in which the associated taxa clustered together is shown next to the branches. Initial tree(s) for the heuristic search were obtained automatically by applying Neighbor-Join and BioNJ algorithms to a matrix of pairwise distances estimated using the Maximum Composite Likelihood (MCL) approach, and then selecting the topology with superior log likelihood value. A discrete Gamma distribution was used to model evolutionary rate differences among sites (5 categories (+G, parameter = 0.3870)). The tree is drawn to scale, with branch lengths measured in the number of substitutions per site. This analysis involved 41 nucleotide sequences, including ones in this study (*), from type strains (T) and Chytridium olla UACCC ARG100 (T) used as an outgroup.](/cms/asset/ecb9affc-d949-4b1c-b9dc-e8df0ce144cc/tmyb_a_2008103_f0004_b.jpg)
Figure 5. Phylogenetic tree of Orders Hypocreales, Trichosphaeriales and Sordariales (Class Sordariomycetes, Phylum Ascomycota) based on ITS rRNA genes. The evolutionary history was inferred by using the Maximum Likelihood method and Kimura 2-parameter model [Citation54]. The tree with the highest log likelihood (–3297.12) is shown. The percentage of trees in which the associated taxa clustered together is shown next to the branches. Initial tree(s) for the heuristic search were obtained automatically by applying Neighbor-Join and BioNJ algorithms to a matrix of pairwise distances estimated using the Maximum Composite Likelihood (MCL) approach, and then selecting the topology with superior log likelihood value. A discrete Gamma distribution was used to model evolutionary rate differences among sites (5 categories (+G, parameter = 0.3655)). The tree is drawn to scale, with branch lengths measured in the number of substitutions per site. This analysis involved 18 nucleotide sequences, including ones in this study (*), from type strains (T) and Chytridium olla UACCC ARG100 (T) used as an outgroup.
![Figure 5. Phylogenetic tree of Orders Hypocreales, Trichosphaeriales and Sordariales (Class Sordariomycetes, Phylum Ascomycota) based on ITS rRNA genes. The evolutionary history was inferred by using the Maximum Likelihood method and Kimura 2-parameter model [Citation54]. The tree with the highest log likelihood (–3297.12) is shown. The percentage of trees in which the associated taxa clustered together is shown next to the branches. Initial tree(s) for the heuristic search were obtained automatically by applying Neighbor-Join and BioNJ algorithms to a matrix of pairwise distances estimated using the Maximum Composite Likelihood (MCL) approach, and then selecting the topology with superior log likelihood value. A discrete Gamma distribution was used to model evolutionary rate differences among sites (5 categories (+G, parameter = 0.3655)). The tree is drawn to scale, with branch lengths measured in the number of substitutions per site. This analysis involved 18 nucleotide sequences, including ones in this study (*), from type strains (T) and Chytridium olla UACCC ARG100 (T) used as an outgroup.](/cms/asset/0fe01a79-dc9b-45f6-9310-4f6debbefaf9/tmyb_a_2008103_f0005_b.jpg)
Figure 6. Phylogenetic tree of Order Saccharomycetales (Class Sacharomycetes, Phylum Ascomycota) based on ITS rRNA genes. The evolutionary history was inferred by using the Maximum Likelihood method and Tamura 3-parameter model [Citation54]. The tree with the highest log likelihood (–3834.69) is shown. The percentage of trees in which the associated taxa clustered together is shown next to the branches. Initial tree(s) for the heuristic search were obtained automatically by applying Neighbor-Join and BioNJ algorithms to a matrix of pairwise distances estimated using the Tamura 3 parameter model, and then selecting the topology with superior log likelihood value. A discrete Gamma distribution was used to model evolutionary rate differences among sites (5 categories (+G, parameter = 0.5029)). This analysis involved 42 nucleotide sequences, including ones in this study (*), from type strains (T) and Chytridium olla UACCC ARG100 (T) used as an outgroup.
![Figure 6. Phylogenetic tree of Order Saccharomycetales (Class Sacharomycetes, Phylum Ascomycota) based on ITS rRNA genes. The evolutionary history was inferred by using the Maximum Likelihood method and Tamura 3-parameter model [Citation54]. The tree with the highest log likelihood (–3834.69) is shown. The percentage of trees in which the associated taxa clustered together is shown next to the branches. Initial tree(s) for the heuristic search were obtained automatically by applying Neighbor-Join and BioNJ algorithms to a matrix of pairwise distances estimated using the Tamura 3 parameter model, and then selecting the topology with superior log likelihood value. A discrete Gamma distribution was used to model evolutionary rate differences among sites (5 categories (+G, parameter = 0.5029)). This analysis involved 42 nucleotide sequences, including ones in this study (*), from type strains (T) and Chytridium olla UACCC ARG100 (T) used as an outgroup.](/cms/asset/2c645ec5-8c91-4cf3-a8e9-422cd891b239/tmyb_a_2008103_f0006_b.jpg)
Figure 7. Phylogenetic tree of Order Polyporales (Class Agaricomycetes, Phylum Basidiomycota), Order Sporidiobolales (Class Microbotryomycetes, Phylum Basidiomycota) and Order Mucorales (Class Mucoromycetes, Phylum Mucoromycota) based on ITS rRNA genes. The evolutionary history was inferred by using the Maximum Likelihood method and Tamura 3-parameter model [Citation54]. The tree with the highest log likelihood (–3580.61) is shown. The percentage of trees in which the associated taxa clustered together is shown next to the branches. Initial tree(s) for the heuristic search were obtained automatically by applying Neighbor-Join and BioNJ algorithms to a matrix of pairwise distances estimated using the Tamura 3 parameter model, and then selecting the topology with superior log likelihood value. A discrete Gamma distribution was used to model evolutionary rate differences among sites (5 categories (+G, parameter = 0.8620)). The tree is drawn to scale, with branch lengths measured in the number of substitutions per site. This analysis involved 14 nucleotide sequences, including ones in this study (*), from related type strains (T) and Chytridium olla UACCC ARG100 (T) used as an outgroup.
![Figure 7. Phylogenetic tree of Order Polyporales (Class Agaricomycetes, Phylum Basidiomycota), Order Sporidiobolales (Class Microbotryomycetes, Phylum Basidiomycota) and Order Mucorales (Class Mucoromycetes, Phylum Mucoromycota) based on ITS rRNA genes. The evolutionary history was inferred by using the Maximum Likelihood method and Tamura 3-parameter model [Citation54]. The tree with the highest log likelihood (–3580.61) is shown. The percentage of trees in which the associated taxa clustered together is shown next to the branches. Initial tree(s) for the heuristic search were obtained automatically by applying Neighbor-Join and BioNJ algorithms to a matrix of pairwise distances estimated using the Tamura 3 parameter model, and then selecting the topology with superior log likelihood value. A discrete Gamma distribution was used to model evolutionary rate differences among sites (5 categories (+G, parameter = 0.8620)). The tree is drawn to scale, with branch lengths measured in the number of substitutions per site. This analysis involved 14 nucleotide sequences, including ones in this study (*), from related type strains (T) and Chytridium olla UACCC ARG100 (T) used as an outgroup.](/cms/asset/c4fbb808-b2f6-44d1-a169-86a5766ba024/tmyb_a_2008103_f0007_b.jpg)
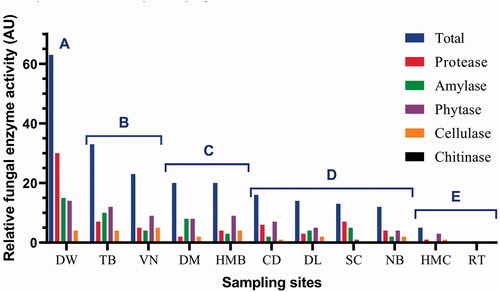
Figure 8. Relative extracellular enzyme activity (AU) of all fungal strains from each sample at Nha Trang Bay and Van Phong Bay, Khanh Hoa province, Vietnam. For each strain, 1 AU was defined as an enzyme activity unit with hydrolysis zone diameter D–d = 10–15 mm, 2 AU for D–d = 15-20 mm and 3 AU for D–d > 20 mm. Based on total relative enzyme activity shown, the samples were divided into 5 groups: Group A (>60 AU), Group B (23–33 AU), Group C (20 AU), Group D (12–16 AU), and Group E (0–5 AU).