Figures & data
Figure 1. Location of Ragi tapai sample collection sites in Java Island.1. Bandung, 2. Sumedang, 3. Muntilan, 4. Yogyakarta, 5. Blora, 6. Bondowoso. Map from Google Maps.
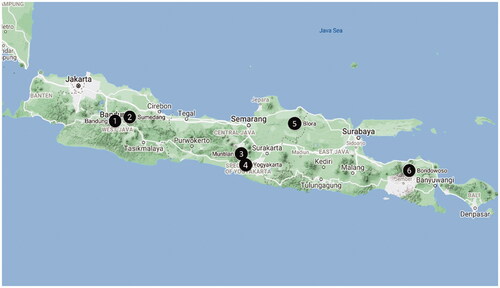
Table 1. Macroscopic and microscopic characteristics of Ragi tapai isolatesa.
Figure 2. Abortive sporangia of Ragi tapai isolates (400x). (A) BDG, (B) SMD, (C) MTL, (D) BLR, (E) YOG, (F) BDS.
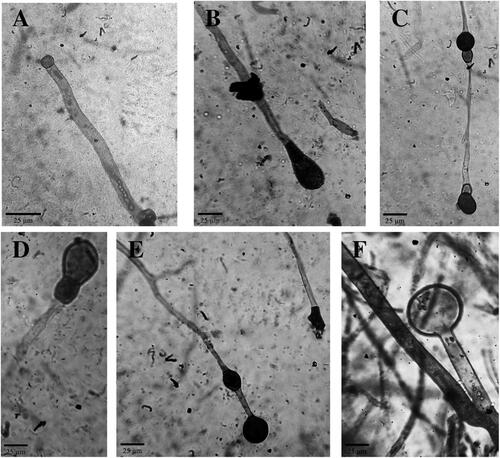
Figure 3. Microscopic features of Ragi tapai isolates. (A) oval abortive sporangia with enlarged apophyses SMD (400x); (B) Coenocytic hypha YOG (400x); (C) Zygospore YOG (400x); (D) Chlamydospores BLR (100x); (E) Intercalary chlamydospores BDS (400x); (F) Y-shaped spore-like bodies BLR (400x).
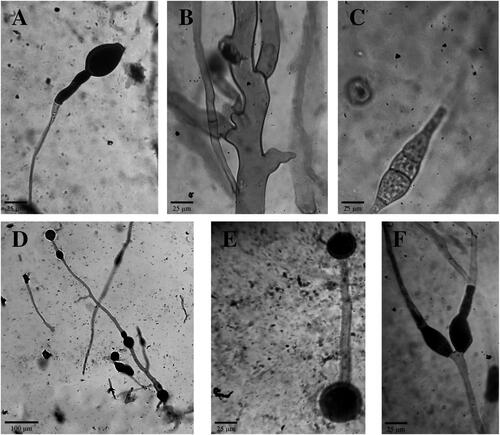
Table 2. NCBI BLAST results of ITS1/ITS2 region of ribosomal DNA.
Table 3. NCBI BLAST results of D1/D2 region of ribosomal DNA.
Figure 4. Phylogenetic tree of ITS1/ITS2 region using the Neighbor-Joining (NJ) method and Kimura-2-parameter (K2P) with 1000 bootstrap value.
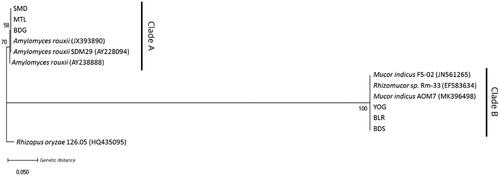
Figure 5. Phylogenetic tree of D1/D2 region using the Neighbor-Joining (NJ) method and Kimura-2-parameter (K2P) with 1000 bootstrap value.
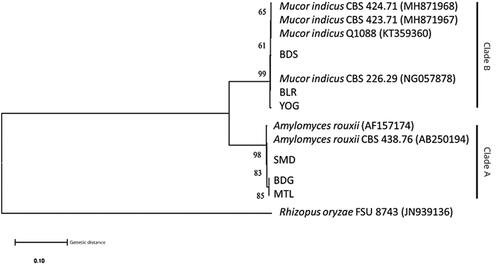
Table 4. Genetic variation between clades of ITS1/ITS2 and D1/D2 regions of ribosomal DNA.
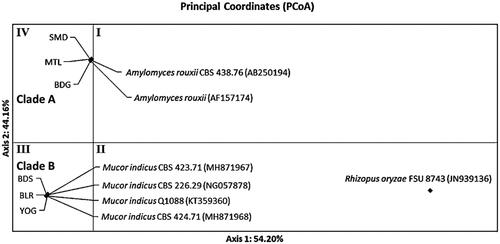
Figure 6. Distribution pattern of ragi isolates using Principal Coordinates Analysis (PCoA) based on ribosomal genes ITS1/ITS2.
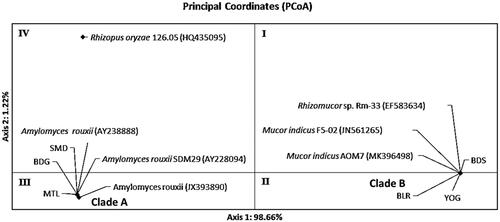
Figure 7. Distribution pattern of ragi isolates using Principal Coordinates Analysis (PCoA) based on ribosomal genes D1/D2.