
Figures & data
Figure 1. Site information where strains are Isolated. Small district unit (-si, -gun, and -myeon) names of the site are described by points and large unit (-do) names are described by colors of the points.
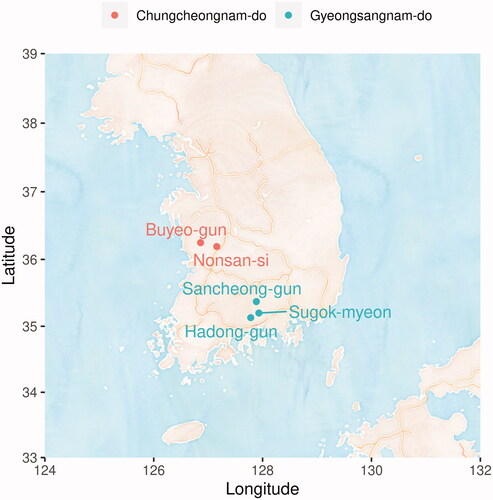
Figure 2. DNA fragments of AFLP and the fragment phylogeny. Left of the plots shows the specifically amplified genomic DNA length information after the DNA fragmentation. Phylogeny on the right is calculated by Bray-Curtis distance of the length and WPGMA clustering. Group displayed by pink and yellow translucent rectangles are determined based on 0.4.
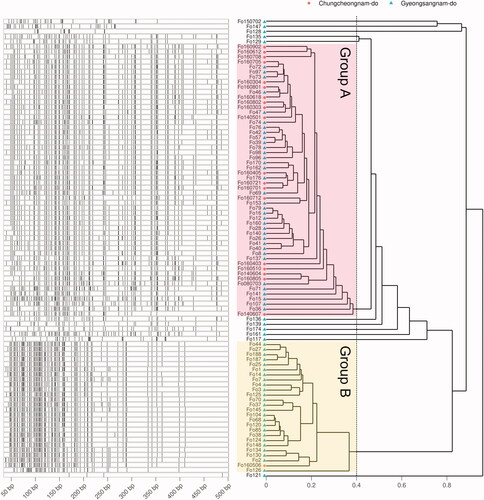
Figure 3. Comparison of clean zones generated by S4-7 and IC50 between two phylogenetic groups and location. AFLP phylogenic group display in left panel and location group in right panel. The Student's T-test analyzes the difference of clean zone length grouped by location (B) and tebuconalzole IC50 (C, D). Clean zone length grouped by the phylogeny (A), Prochloraz-Mn IC50 (E, F), and copper hydroxide IC50 (G, H) difference are calculated by the Mann–Whitney U test, as the Lilliefors test for normality is judged not to be normally distributed. (Significance level: ***p < 0.001; **p < 0.01; * p < 0.05; ns p > 0.05).
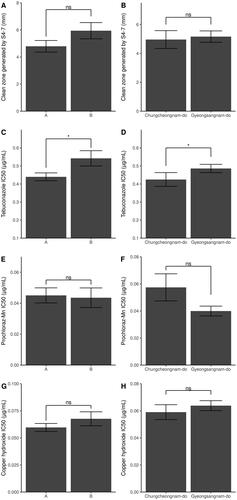
Figure 4. The genomic DNA fragment PCA results. Points meaning each the Fusarium oxysporum f. sp. fragariae strain are flat. To portray the characteristics of each strain, it is represented by several panels and the colors of the dots are indicated differently. (A) AFLP phylogeny group. (B) small unit location group. (C) large unit location group. (D) host variety groups. (E) Antagonist S4-7 sensitivity group. (F) Tebuconazole IC50 group. (G) Prochloraz-Mn IC50 group. (H) Copper hydroxide IC50 group. (I) Mycelial phenotype. The ellipses depict the extent to which 95% of the points are distributed.
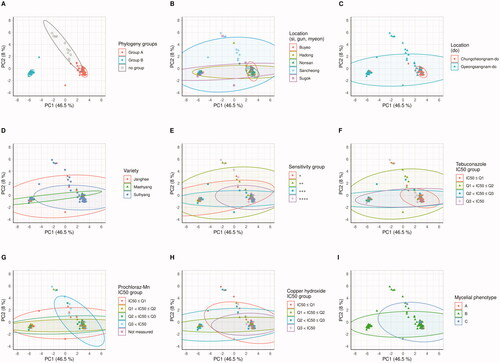
Table 1. PERANOVA and paired-wised PERANOVA with FDR method.