Figures & data
Figure 1. Tar spots of Lonicera japonica associated with Rhytisma lonicericola. (a, b) Tar spots on the leaf surface in autumn. (c) Small newly infected tar spots in spring. (d) Prominent tar spots on overwintered leaves in May. Note the disease-free, newly expanded leaves. (e) Tar spots on overwintered leaf surface. (f) Opened ascostroma on the leaf surface, exposing the hymenia. (g) Ascomata in vertical section. ads = adaxial leaf surface, ol = outer layer of the stroma, hy = hymenium. (h) Hymenial layer of an ascoma. as = ascus, pa = paraphysis. (i, j) Asci with ascospores. (k, l) Ascospores.
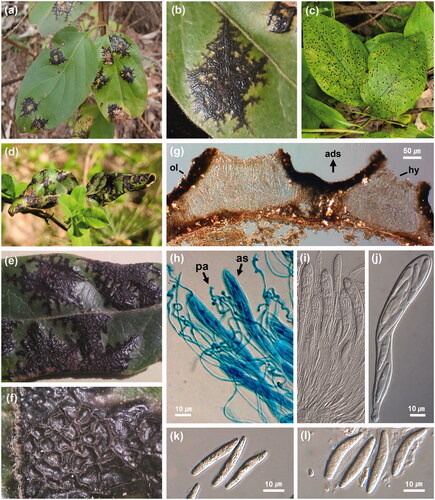
Figure 2. Phylogenetic relationship between Rhytisma lonicericola specimens and the reference isolates of related Rhytisma species retrieved from the GenBank database, inferred using Maximum likelihood method based on an analysis of ITS rDNA region sequences. Bootstrap values based on 1000 replications are indicated at the branches. The scale bar represents 0.02 nucleotide substitutions per site. The Korean specimens characterized in this study are shown in bold.
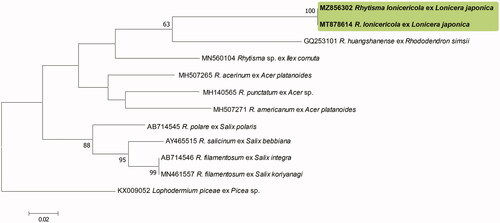
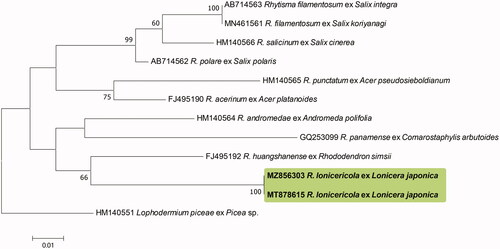
Figure 3. Phylogenetic relationship between Rhytisma lonicericola specimens and the reference isolates of related Rhytisma species retrieved from the GenBank database, inferred using Maximum likelihood method based on an analysis of LSU rDNA region sequences. Bootstrap values based on 1000 replications are indicated at the branches. The scale bar represents 0.01 nucleotide substitutions per site. The Korean specimens presented in this study are shown in bold.