
Figures & data
Figure 1. Morphological and microscopic examination of Ceratorhiza hydrophila. (a) growth on Potato dextrose agar media after seven days of incubation at 25ºC, (b) brown globose sclerotia (4X), (c) septate branched mycelium (40×).
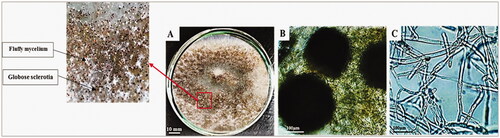
Figure 2. Maximum likelihood tree showed that Ceratorhiza hydrophila isolate EG19 (MK387081) had a high similarity of 99% toward Ceratorhiza hydrophila isolate SR6 (JQ359765).
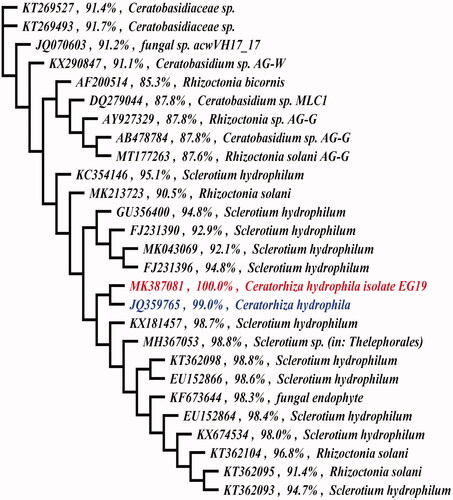
Figure 3. Ceratorhiza hydrophila enzymatic activities after incubation for 72 h at 25ºC. (a) protease, (b) cellulase.
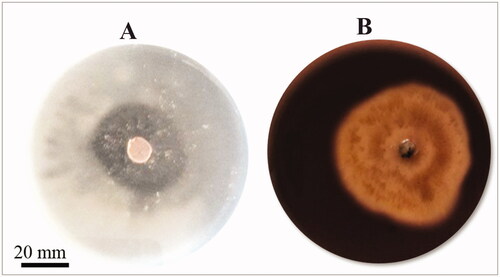
Table 1. Enzyme production by Ceratorhiza hydrophila.
Table 2. Antibacterial activity of the crude extracts of Ceratorhiza hydrophila against different tested bacterial strains.
Figure 4. 1H NMR spectra of the polar extract of Ceratorhiza hydrophila. (a) Aliphatic region, (b) sugars abundance signals region, (c) aromatic region.
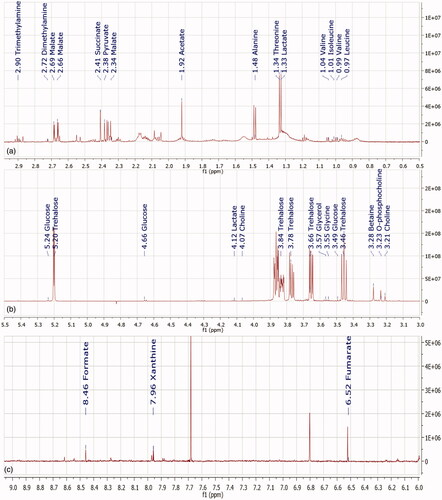
Table 3. The identified compounds in the polar extract of Ceratorhiza hydrophila with their chemical formulas, chemical shifts, multiplicity and coupling constants.