Figures & data
Figure 1. Relative abundance of top10 order and family. The two top 10 samples are selected based on the average of all samples in order (A) and in family (B).
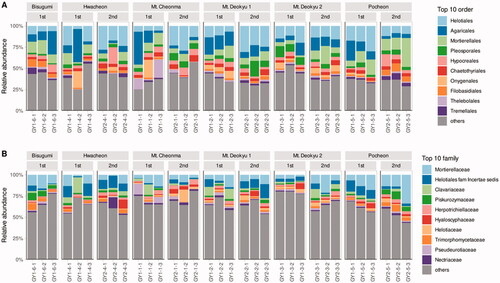
Figure 2. Principal coordinates analysis in national habitat. The panels are emphasized by (A) habitat location, (B) sampling time, (C) shoot length, (D) area, (E) population. The place and sampling times are indicated by different colors and the same location samples in different times connect the lines. The characteristics of the measured habitats are indicated by a blue and black gradation.
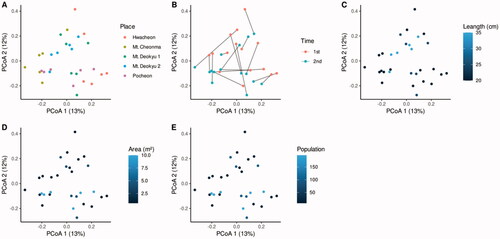
Table 1. PERMANOVA of the PCoA results in natural habitats of Cypripedium japonicum.
Figure 3. Correlation between Lycoperdon nigrescens and Cypripedium japonicum Thunberg population. (A) real values. (B) Ranks. The blue line indicates a regression in ranks. Among 243 Spearman’s ranking correlations of taxonomy and habitat indicators, only L. nigrescens were positively correlated with population. Bonferroni corrected p-value is 0.033 and p-value meaning correlation is 0.634.
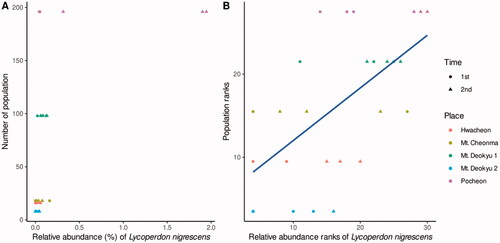
Figure 4. Difference abundance between the native habitats and the artificial garden. This analysis was run by DESeq2 package in R. The adjusted p-values were conducted by Bonferroni adjustment. (A) all of the analyzed is zoom in and separated to (B) more in nature, and (C) more in the garden. The criteria for the significant are padj < 0.001, and │log2(fold change)│ > 2.
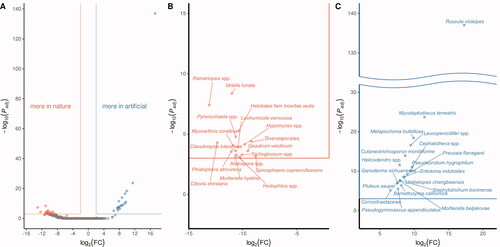
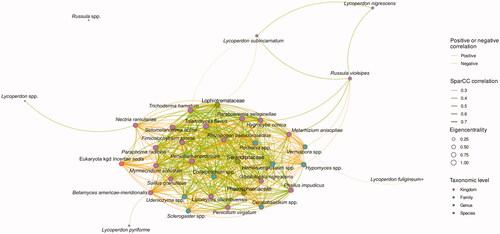
Figure 5. Correlation network among taxonomic groups in the natural habitats. When correlation p-value is under 0.05, top 30 of eigencentrality, Lycopedon and Rusulla are selectively described. Green and yellow lines mean positive and negative correlation and their thickness mean correlation magnitude. The size of the point represents the eigencentrality of a significant network, including all taxonomic groups not plotted in this figure. The top 30 is described by red edge at the point. The filled colors of the points represented the taxonomic levels of the groups.