
Figures & data
Figure 1. Eritadenine yields (A), biomass (B) and final pH (C) with the LED lights used during submerged cultures. Values are averages of ± DS (n = 3). Different letters above the bars show statistical differences at p < 0.05, according to ANOVA and Tukey tests. Bl is blue light; Gr is green light.
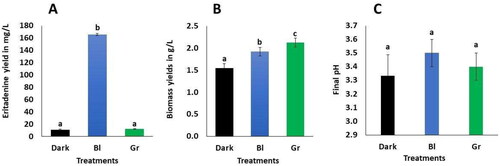
Figure 2. Eritadenine yields, biomass and final pH in submerged cultures using various nitrogen sources. The values presented are the means with standard deviations (±DS) and are based on a sample size of n = 3. Different letters above the bars show statistical differences at p < 0.05; eritadenine and biomass (A and B) were evaluated by ANOVA and Tukey tests, while final pH (C) evaluated by Kruskal-Wallis test. YE1 is yeast extract at 1 g/L; YE2 is yeast extract at 2 g/L; Pep1 is peptone at 1 g/L; Pep2 is peptone at 2 g/L.
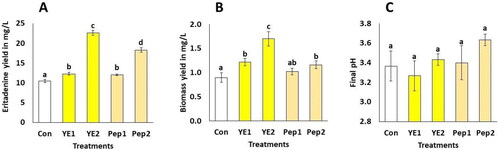
Figure 3. Isotherms of Langmuir and Freundlich adsorption models with their parameters for eritadenine adsorption from submerged cultures of shiitake with activated charcoal and amberlite IR120Na+. (A) Langmuir of AC; (B) Langmuir of IR120 Na+; (C) Freundlich of AC; and (D) Freundlich of amberlite IR120 Na+.
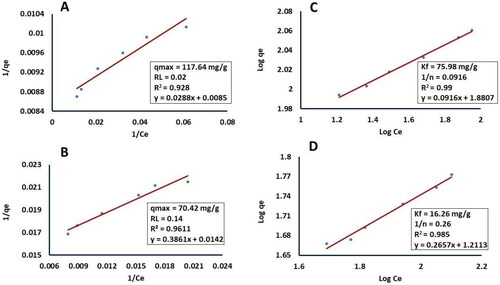
Figure 4. Comparison of the phytotoxic effects of the cultures extract containing eritadenine and pure eritadenine on Chrysanthemum morifolium plants. (A, B) HPLC chromatograms of the standard substance and the extract. (C) Phytotoxic effect of the extract at 0.25% and its control (D). (E) Phytotoxic effect of glyphosate (Gli), pure eritadenine (Eri) and control (Con).
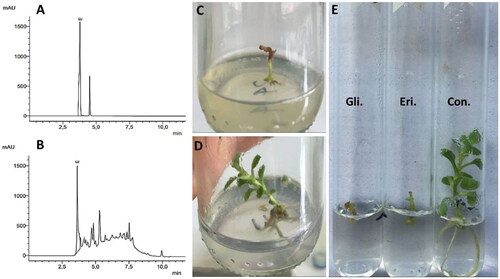
Figure 5. In vitro phytotoxic effects of the cultures extract containing eritadenine at 0.125% on Chrysanthemum morifolium. Plant values are averages of ± DS (n = 10). Different letters above the bars show statistical differences at p < 0.05, according to the U Mann-Whitney test. (A) length of stems. (B) number of leaves. (C) length of roots. The data for roots were not statistically analyzed; the average values are shown on the corresponding bars.
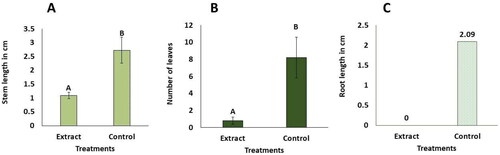
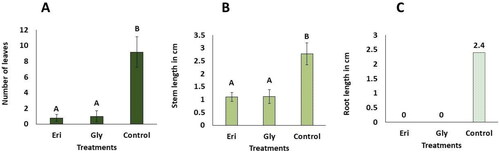
Figure 6. In vitro phytotoxic effects of pure eritadenine and glyphosate at 200 mg/L on Chrysanthemum morifolium. Values represent averages of ± DS (n = 5). Treatments marked with different letters indicate statistical significance at p < 0.05, according to Kruskal-Wallis and Dunn tests (Eri. Eritadenine; Gly. Glyphosate). (A) number of leaves; (B) length of stems; (C) length of roots. It’s important to note that the data related to root measurements were not subjected to statistical analysis; however, average values are presented on the respective bars.
Data availability statement
Data supporting the findings of this study are available from the corresponding author upon an e-mail request.