
Figures & data
Table 1. The information on Neophysopella kraunhiae specimens used for morphological and phylogenetic analysis.
Table 2. List of environmental variables using distribution models.
Figure 1. Rust disease caused by Neophysopella kraunhiae on Corydalis incisa. (A) Infected leaves of C. incisa with spermogonial stage; (B) Infected leaves of C. incisa with aecial stage; (C) Spermogonia; (D) Aecia; (E) Aeciospores under a differential interference contrast (DIC) microscope; (F) Spermogonium under a scanning electron microscope (SEM); (G) Aecia under a SEM; (H) Aeciospore under a SEM.
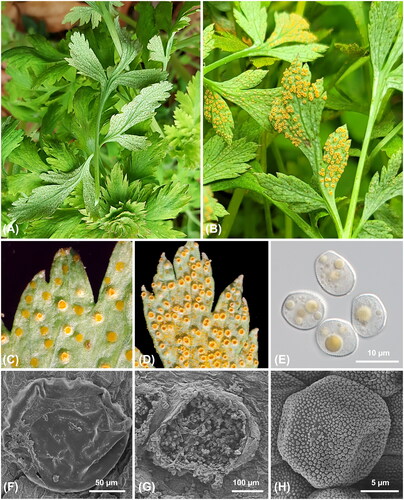
Figure 2. Rust disease caused by Neophysopella kraunhiae on Wisteria floribunda. (A) The chlorotic spots on the upper leaf surface of W. floribunda; (B) Uredinia on the lower leaf surface of W. floribunda; (C) Uredinia; (D) Urediniospores under a DIC microscope; (E) Teliospores under a DIC microscope; (F) Uredinia under a SEM; (G) Urediniospores under a SEM; (H) Wall surface of an urediniospore under a SEM.
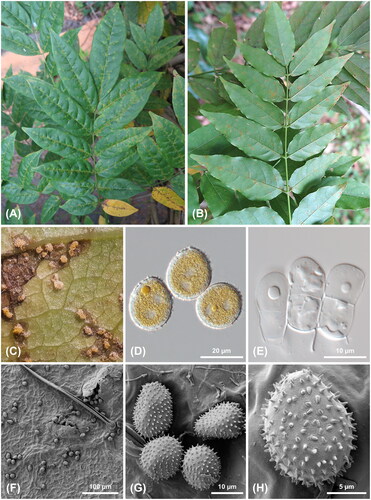
Figure 3. Maximum likelihood tree of Neophysopella species based on the internal transcribed spacer (ITS) (A) and large subunit (LSU) (B) rDNA sequences. The bootstrapping values higher than 70% are given above the branches. The green box represents Neophysopella kraunhiae. The Korean specimens sequenced in the present study are shown in bold.
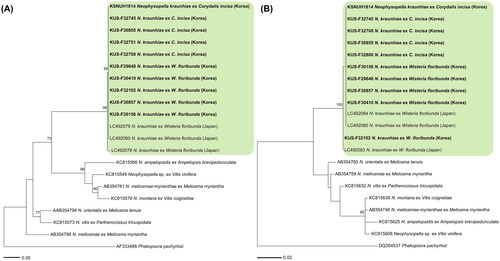
Figure 4. Pathogenicity test. (A) Inoculations of rust aeciospores harvested from Corydalis incisa onto Wisteria floribunda leaves; (B) Controls; (C,D) A leaf with chlorotic spots three week after inoculation; (E) Uredinium; (F) Echinulate and immature uredinia.
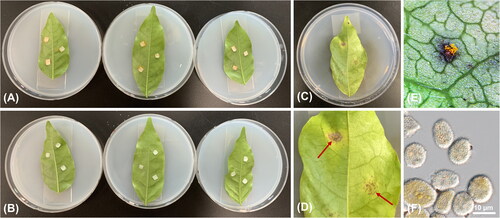
Figure 5. Evaluation of variables within LQH-2 model for Neophysopella kraunhiae. (A) The permutation importance and contribution of environmental variables; (B) The results of the jackknife tests; (C) Response curves between the occurrence of wisteria rust and environmental variables.
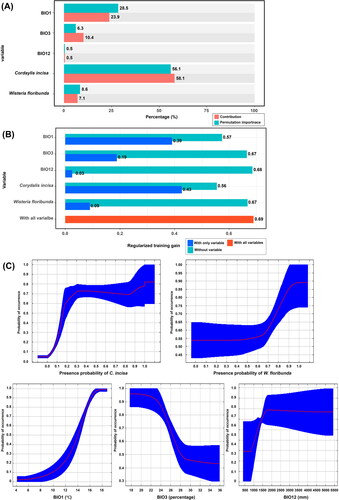
Figure 6. Projection for current and future (2050s) distributions of a rust fungus (Neophysopella kraunhiae) and its two host plants (Corydalis incisa and Wisteria floribunda), utilizing the maximum entropy model (Maxent) under SSP245 and SSP585 scenarios. (A–C) Corydalis incisa; (D–F) Wisteria floribunda; (G–I) Neophysopella kraunhiae.
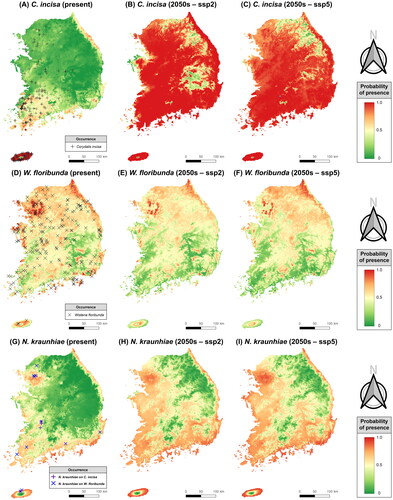
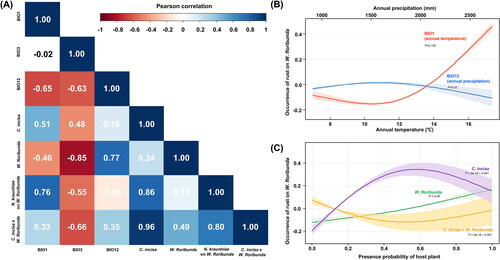
Figure 7. Statistical analysis of the interaction among rust disease (caused by Neophysopella kraunhiae), its two host plants (Corydalis incisa and Wisteria floribunda), and climate variables. (A) Pearson’s correlation matrix displaying the correlations between the rust occurrence on W. floribunda and bioclimatic variables; (B) Response curves from the Generalized Additive Model (GAM), depicting the relationship between the occurrence of wisteria rust and two variables (annual temperature and precipitation); (C) Response curves from the GAM, illustrating the interdependence between the rust occurrence on W. floribunda and the distribution of the two hosts; 95% confidence intervals indicated by colored shading.
Data availability statement
All sequence data used in this study are available in NCBI GenBank.