
Figures & data
Figure 1. Basic rework cycle (adopted from Cooper, Citation1993).
Figure 2. IDEF diagram of the research design.
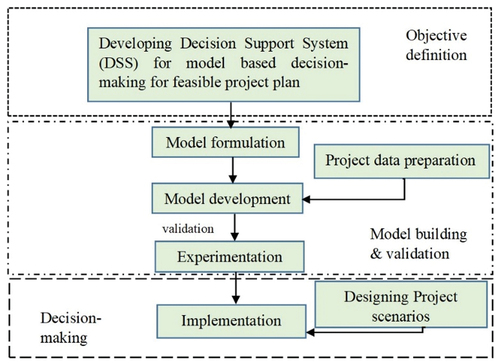
Figure 3. Proposed methodology.
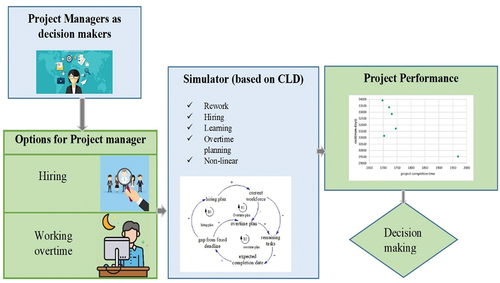
Figure 4. CLD for hiring and overtime management.
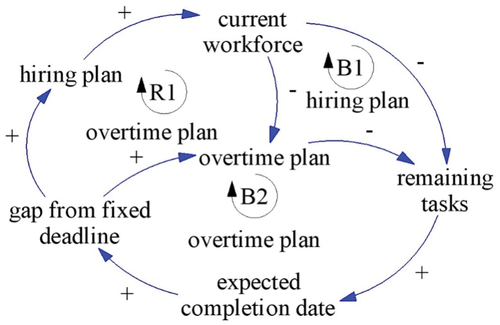
Figure 5. Causal relationships among project factors and rework.
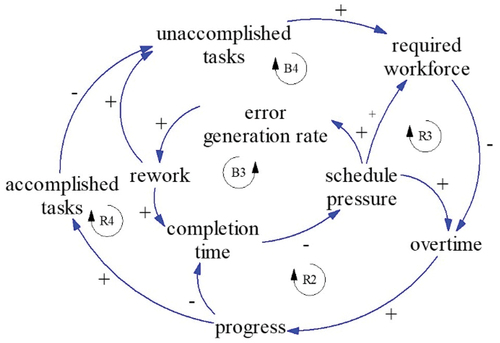
Figure 6. Modified rework cycle.
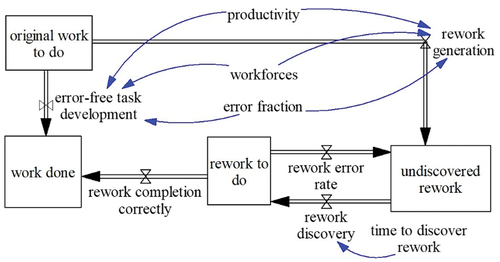
Figure 7. Typical behaviour of rework.
Figure 8. The learning curve for the new workforce.
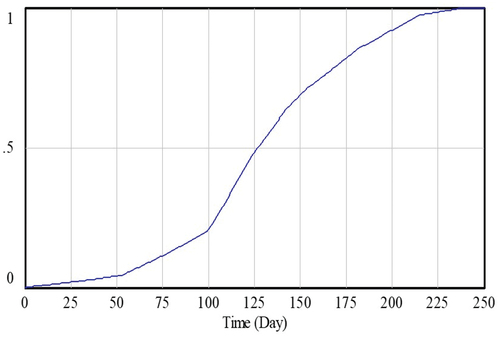
Figure 9. Overview of overtime planning.
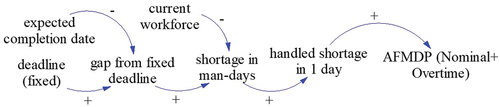
Figure 10. Impact of overtime on productivity.
Table 1. Decisions concerninghiring and overtime.
Table 2. Input parameters (Li, Citation2008).
Table 3. Scenario list based on hiring and overtime optiondecisions.
Figure 11. Expected project completion time for each scenario.
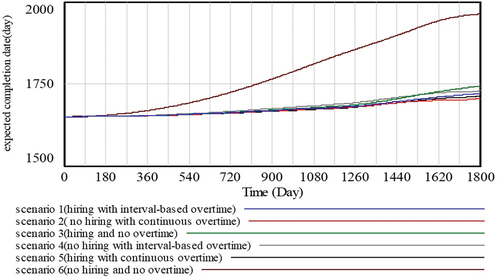
Figure 12. Impact of hiring and overtime on productivity.
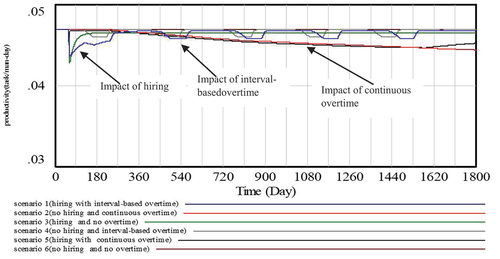
Figure 13. Error-free task development (solid line) with rework generation (dashed line).
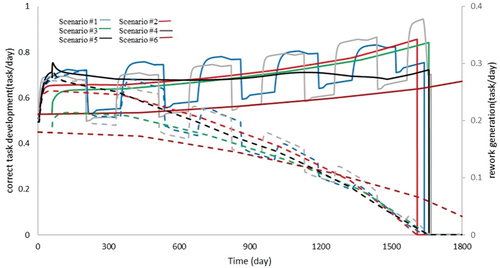
Figure 14. Effect of rework on the accomplishment of tasks (for Scenario #1).
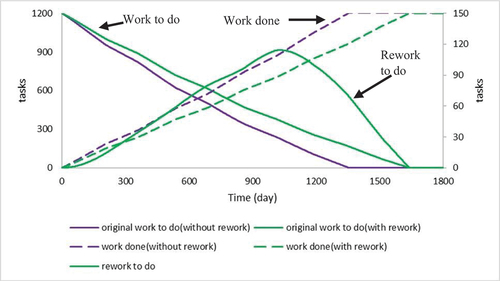
Figure 15. Several choices of project completion time with man-days for each scenario (for decision-making).
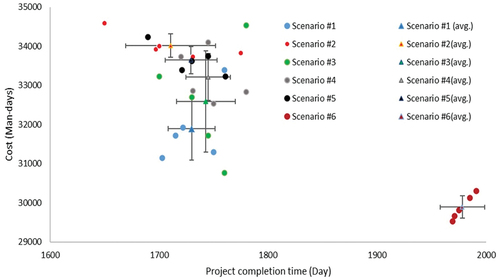
Table 4. Summary results for each scenario by identifying feasible performance.