Figures & data
Table 1. Demographic and clinical data of the patients with thyroid cancers.
Table 2. Demographic, clinical data and histological and pathological characteristics of the tumour specimens according to the thyroid tumour type.
Table 3. Immunohistochemical results for VEGF expression and S100- , CD1a- and CD83-positive cells in different types of thyroid cancers.
Figure 1. Vascular endothelial growth factor (VEGF) expression in thyroid tissue: (a) VEGF-positive immune reaction in follicular cells of papillary thyroid cancer (×100 magnification); (b) VEGF expression in follicular cells of follicular thyroid cancer (×200 magnification); (c) VEGF negative immune reaction in anaplastic thyroid cancer (×200 magnification).
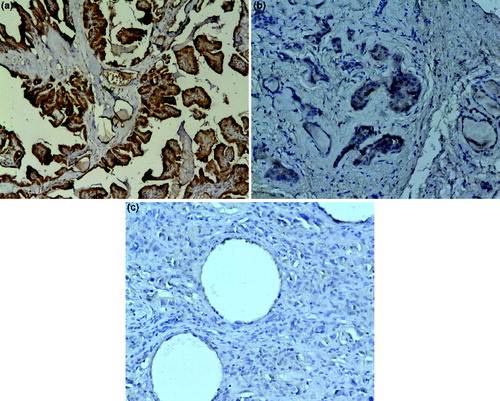
Figure 2. Microvessel density (MVD) in thyroid tissue: (a) CD31-positive vessels in a papillary thyroid cancer (×100 magnification); (b) CD31 staining in blood vessels in anaplastic thyroid cancer (×200 magnification); (c) CD31 staining in blood vessels in follicular thyroid cancer (×200 magnification).
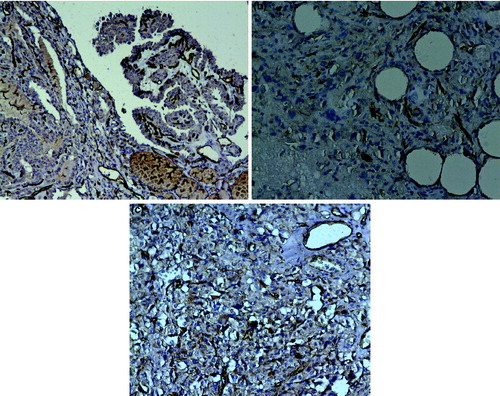
Figure 3. Blood vessel density in different types of thyroid cancers.
Note: PTC, papillary thyroid cancer; FTC, follicular thyroid cancer; ATC, anaplastic thyroid cancer; OTC, oncocytic thyroid cancer. Data are presented as mean ± SD (*p = 0.039).
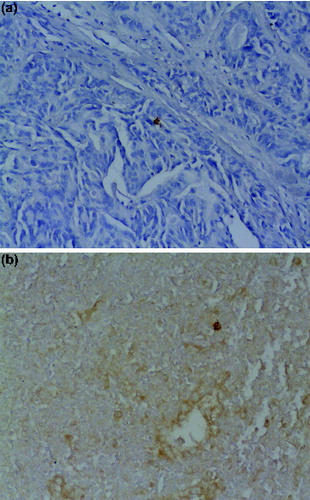
Figure 4. Dendritic cells in thyroid tissue: (a) CD1a-positive dendritic cells in papillary thyroid cancer (×200 magnification); (b) CD83-positive dendritic cells in anaplastic thyroid cancer (×200 magnification).
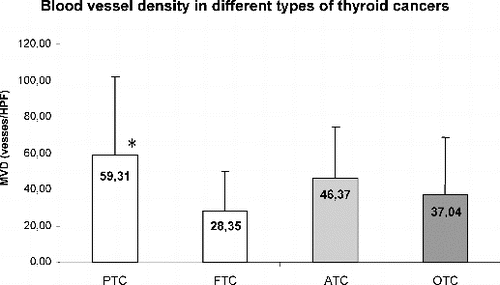
Figure 5. Correlation between CD1a- and CD83-positive dendritic cells in OTC (oncocytic thyroid cancer).
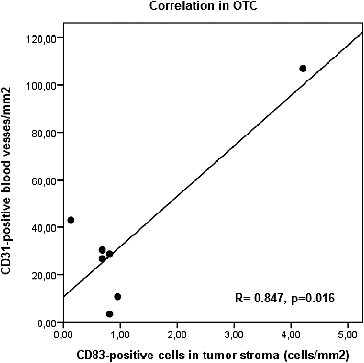
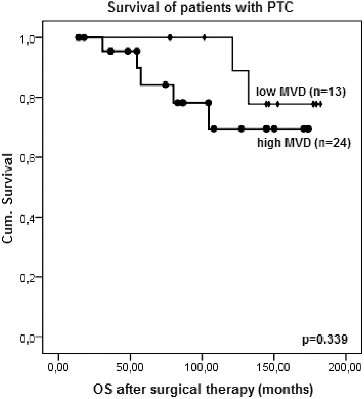
Figure 6. Kaplan–Meier survival plot for overall survival (OS) after surgical therapy of patients with PTC according to the microvessel density (MVD) (log-rank test).