Figures & data
Figure 1. Normal ECG signal course.
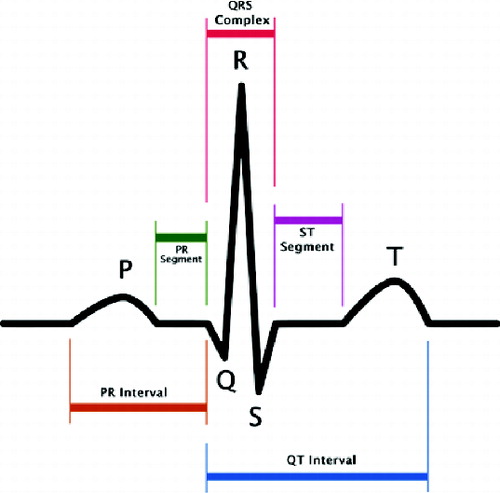
Figure 2. Ultrasonic picture taken from the video signal.
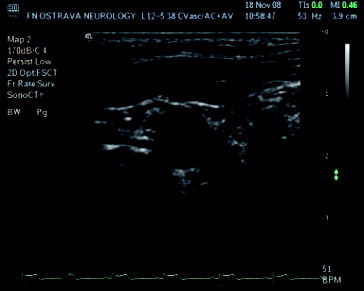
Figure 3. ECG graph pre-processed by thresholding.
Figure 4. Variance computation.
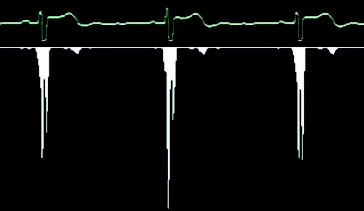
Figure 5. Image with missing artery parts (a); artery part repaired using a reference image and the image with missing parts artery for correction (b); repaired artery parts, completed by an average of the values of reference images (c); fixed artery part with a user defined colour (d).
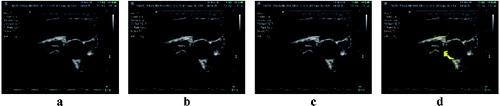
Figure 6. Image with objects designated for correction (a); reference image number 1 (b); reference image number 2 (c); repaired objects in the image when the objects of reference images 1 and 2 are used (d).
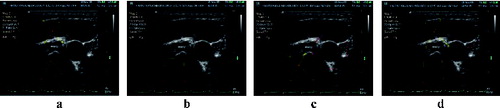
Figure 7. Original image (a); image after classical histogram equalization method (b); image after CLAHE application (c).
Figure 8. Smoothed image after cropping and threshold (a), after edge detection (b) and after artery side reconstruction (c).
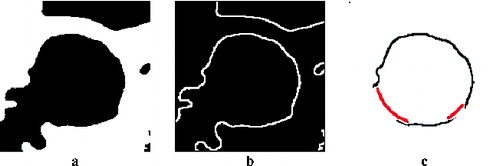
Figure 9. The resulting polygon after inner artery side segmentation.
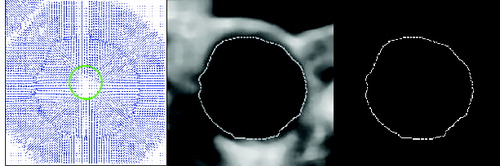
Figure 10. Sample result of the proposed algorithm for artery detection and segmentation.
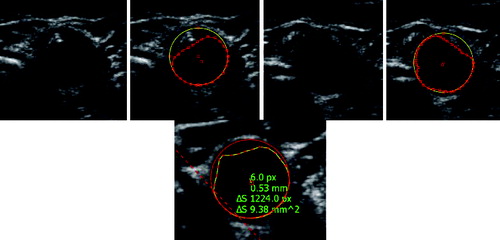
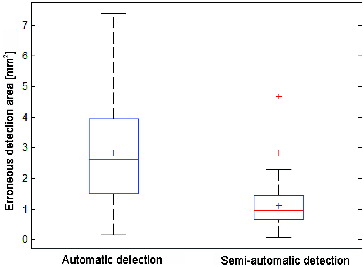
Figure 11. Detection error box plot.