Figures & data
Figure 1. Primer sequences designed based on the P-loop and kinase-2 domain of NBS.
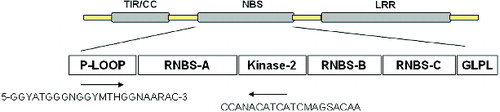
Figure 2. PCR amplification products of NBS RGAs in mango. M: DNA Marker V; Lane 1: blank control; Lane 2: control using water as a template; Lane 3: PCR products of NBS genes amplified with forward and reverse primers for mango.
Table 1 Variation sites of 16 RGAs sequences in mango.
Figure 3. Alignment of NBS-type gene sequences in mango.
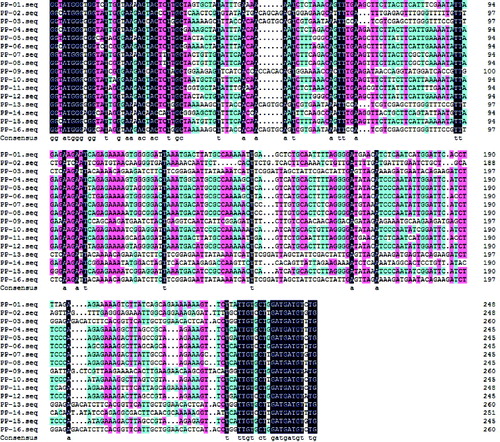
Figure 4. Polymorphism characteristic of NBS–LRR analogues isolated from mango (pp-01–16). The vertical axis represents the nucleotide diversity (Pi), and the horizontal axis represents the nucleotide position (bp), the curved line represents the change of Pi in different nucleotide positions.
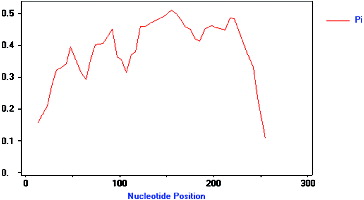
Table 2 Results from the BL2SEQ algorithm showing the extent of identity between the RGAs isolated in the present study.
Figure 5. Phylogenetic tree of NBS resistance RGAs in mango.
Figure 6. Alignment of amino acid sequences from 16 RGAs of mango, RPS2, RPS5 and PP5 of Arabidopsis, Xa1 of rice, L6 of linen, RPM1 of Chinese Kale and SNLR of sorghum. Identical amino acid sequences are blocked with black.
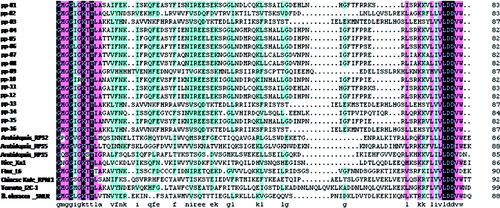
Figure 7. Phylogenetic relationship of amino acid sequences from 16 RGAs isolated in the present study and eight characterized R-genes.