
Figures & data
Figure 1. Wing phenotypes of flies with different genotypes: wild-type wing (A); overexpression of dfmr1 causes ‘notched’ wing phenotype (control) (B); enhancer wing phenotype (C); suppressor wing phenotype (D); overexpression of rok (E); overexpression of sgg (F).
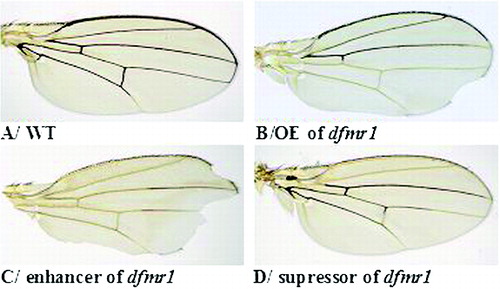
Figure 2. Confocal images of LNv's from adult half-brains with different genotypes: wild type (A); heterozygotes for the dfmr1-null mutation (B); heterozygotes peb[hnt-E8]//+ (C); heterozygotes peb[hnt-E8]//+ (D); double heterozygotes peb[hnt-E8]//+; Fmr1Δ113M//+ (E); heterozygotes rok1//+ (F); double heterozygotes rok1//+; Fmr1Δ113M//+ (G); heterozygotes sggG0263//+ (H); double heterozygotes sggG0263//+; Fmr1Δ113M//+ (I); heterozygotes rasG0380b//+ (J); double heterozygotes rasG0380b//+; Fmr1Δ113M//+ (K). The target-area coverage for each genotype (L); Mean fluorescence intensity (M). All brains are shown at 40× magnification. Error bars indicate SD.
![Figure 2. Confocal images of LNv's from adult half-brains with different genotypes: wild type (A); heterozygotes for the dfmr1-null mutation (B); heterozygotes peb[hnt-E8]//+ (C); heterozygotes peb[hnt-E8]//+ (D); double heterozygotes peb[hnt-E8]//+; Fmr1Δ113M//+ (E); heterozygotes rok1//+ (F); double heterozygotes rok1//+; Fmr1Δ113M//+ (G); heterozygotes sggG0263//+ (H); double heterozygotes sggG0263//+; Fmr1Δ113M//+ (I); heterozygotes rasG0380b//+ (J); double heterozygotes rasG0380b//+; Fmr1Δ113M//+ (K). The target-area coverage for each genotype (L); Mean fluorescence intensity (M). All brains are shown at 40× magnification. Error bars indicate SD.](/cms/asset/1e2c86af-2ffd-4f28-9125-f2b66fd1dfd2/tbeq_a_937897_f0002_oc.jpg)
Table 1. Ectopic branching and defasciculated axonal bundles of Drosophila LNv's.
Figure 3. Western blot analysis. Expression levels in wild-type, dfmr1-null mutants and in the case of dfmr1 overexpression in the brains of: Peb/HNT – about 209 kDa (A); Rok – about 160 kDa (B); Shaggy/GSK3β (C) for each isoform: SGGY (about 56 kDa), SGG10 (about 58 kDa) and SGG39 (about 68 kDa); Ras – about 60 kDa (D). Expression levels of dFMRP (about 85 kDa) in embryos hemizygous for peb[hnt-E8], rok1, sggG0263 or rasG0380b (E) (p > 0.05; n = 3). Quantification of each protein expression from Western blot analysis is shown on the right side. Error bars indicate SD.
![Figure 3. Western blot analysis. Expression levels in wild-type, dfmr1-null mutants and in the case of dfmr1 overexpression in the brains of: Peb/HNT – about 209 kDa (A); Rok – about 160 kDa (B); Shaggy/GSK3β (C) for each isoform: SGGY (about 56 kDa), SGG10 (about 58 kDa) and SGG39 (about 68 kDa); Ras – about 60 kDa (D). Expression levels of dFMRP (about 85 kDa) in embryos hemizygous for peb[hnt-E8], rok1, sggG0263 or rasG0380b (E) (p > 0.05; n = 3). Quantification of each protein expression from Western blot analysis is shown on the right side. Error bars indicate SD.](/cms/asset/b944b36f-b8c8-4aab-bd13-0349588a746f/tbeq_a_937897_f0003_b.gif)