Figures & data
Figure 1. Three-dimensional structure of DehD [Citation19]. The binding-site residues (Val45, Met79, Ala130, Thr131, Val132, Ser133, Arg134, Tyr135, Leu136, Gln138, Asp139, Ala145, Ile147, Ile148, His149, Leu150, Leu151, Ala250, Cys253 and Leu257), 14 residues (Val45, Met79, Ala130, Thr131, Val132, Ser133, Arg134, Tyr135, Leu136, Gln138, Asp139, Ala250,Cys253 and Leu257) are shown in blue. The helices are labelled H1–H10, and the loops are labelled C1–C11.Note: Figure 1 is a reprint of a figure previously published by MDPI-Sudi et al., (2012) Structure prediction, molecular dynamics simulation and docking studies of D-specific dehalogenase from Rhizobium sp. RCI. Int J Mol Sci. 13:15724–15754. published by MDPI.
![Figure 1. Three-dimensional structure of DehD [Citation19]. The binding-site residues (Val45, Met79, Ala130, Thr131, Val132, Ser133, Arg134, Tyr135, Leu136, Gln138, Asp139, Ala145, Ile147, Ile148, His149, Leu150, Leu151, Ala250, Cys253 and Leu257), 14 residues (Val45, Met79, Ala130, Thr131, Val132, Ser133, Arg134, Tyr135, Leu136, Gln138, Asp139, Ala250,Cys253 and Leu257) are shown in blue. The helices are labelled H1–H10, and the loops are labelled C1–C11.Note: Figure 1 is a reprint of a figure previously published by MDPI-Sudi et al., (2012) Structure prediction, molecular dynamics simulation and docking studies of D-specific dehalogenase from Rhizobium sp. RCI. Int J Mol Sci. 13:15724–15754. published by MDPI.](/cms/asset/2d3fe889-749c-4d10-a3d1-8d3977b03d03/tbeq_a_937907_f0001_c.jpg)
Figure 2. Substrate structures. (A) d-2CP ((2R)-2-chloropropionate) and (B) l-2CP ((2S)-2-chloropropionate).
Table 1. Binding energies of DehD complexed with d- and l-2-chloropropionates.
Figure 3. Two-dimensional diagrams of the DehD residues that interact with d-2CP (A) and l-2CP (B). Colour coding: nitrogen, blue; oxygen, red; carbon, black; and chlorine, green. d-2CP and l-2CP bonds are shown in purple; non-substrate bonds are shown in orange; hydrogen bonds are shown in olive green and their lengths are provided; DehD residues that form hydrophobic interactions between DehD [Citation34] and d-2CP and l-2CP are shown as red spikes, and their atoms involved are shown as balls.
![Figure 3. Two-dimensional diagrams of the DehD residues that interact with d-2CP (A) and l-2CP (B). Colour coding: nitrogen, blue; oxygen, red; carbon, black; and chlorine, green. d-2CP and l-2CP bonds are shown in purple; non-substrate bonds are shown in orange; hydrogen bonds are shown in olive green and their lengths are provided; DehD residues that form hydrophobic interactions between DehD [Citation34] and d-2CP and l-2CP are shown as red spikes, and their atoms involved are shown as balls.](/cms/asset/7096b2a5-73c6-4775-b6c9-7ad9d89c1878/tbeq_a_937907_f0003_c.jpg)
Figure 4. Interaction of the activated water molecule with DehD active-site residues. The insert shows an enlarged image of the Val14 and Arg16 interactions with a water molecule.
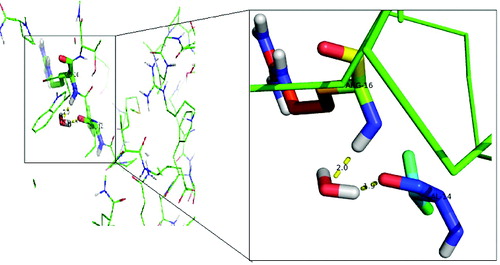
Figure 5. Root-mean-square deviations of the DehD [Citation34] Cα atoms vs. time for the d-2CP–DehD and l-2CP–DehD complexes. d-2CP–DehD (black); l-2CP-DehD (red).
![Figure 5. Root-mean-square deviations of the DehD [Citation34] Cα atoms vs. time for the d-2CP–DehD and l-2CP–DehD complexes. d-2CP–DehD (black); l-2CP-DehD (red).](/cms/asset/3c0a87a5-f3db-4af3-8cc0-c496bda8fa44/tbeq_a_937907_f0005_c.jpg)
Figure 6. Root-mean-square fluctuations of the DehD Cα atoms vs. the number of atoms for the d-2CP–DehD and l-2CP–DehD complexes. d-2CP–DehD (black); l-2CP–DehD (red).
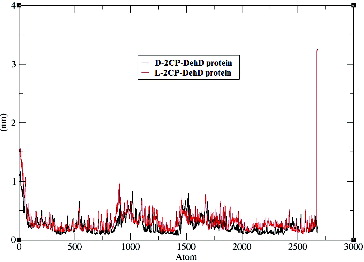
Figure 7. The radii of gyration vs. time for the d-2CP–DehD and l-2CP–DehD complexes. d-2CP–DehD (black); l-2CP–DehD (red).
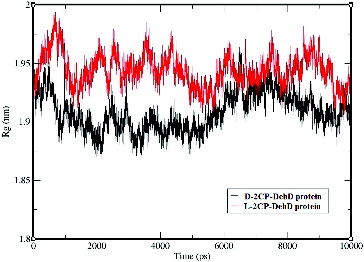
Figure 8. Number of apparent hydrogen bonds vs. time for the d-2CP–DehD (A) and l-2CP–DehD (B) complexes during the MD simulations.
Figure 9. Hydrogen-bond lengths for the d-2CP–DehD and l-2CP–DehD complexes during the MD simulations. d-2CP–DehD (black); l-2CP–DehD (red).
Figure 10. Proposed hydrolytic mechanism for the DehD dehalogenation reaction. Arg16 activates a water molecule for the hydrolytic attack on the carbon atom in position 2, without formation of an ester intermediate.