
Figures & data
Table 1. Locations and average noise levels.
Figure 1. Ambient noise comparison between two places: loud condition (at public transportation, red line) and calm condition (at parks, dashed line).[Citation1,2]
![Figure 1. Ambient noise comparison between two places: loud condition (at public transportation, red line) and calm condition (at parks, dashed line).[Citation1,2]](/cms/asset/7d46c3d9-3e72-4152-a85a-bbdd55d2d436/tbeq_a_949041_f0001_c.jpg)
Figure 2. Auditory field.[Citation7]
![Figure 2. Auditory field.[Citation7]](/cms/asset/897a593c-85de-446b-8d87-fa9a32ca856d/tbeq_a_949041_f0002_c.jpg)
Figure 3. Block diagram of the bone-conduction system. A: voice signal in an ordinary mobile phone; B: modified signal from bone-conducting speakers (B = A′ + C′ + D); A′: amplified high frequency from received signal; C′: compensated signal of ambient noise phase; C: incoming signal from additional microphone; D: incoming signal from ordinary mobile phone microphone.
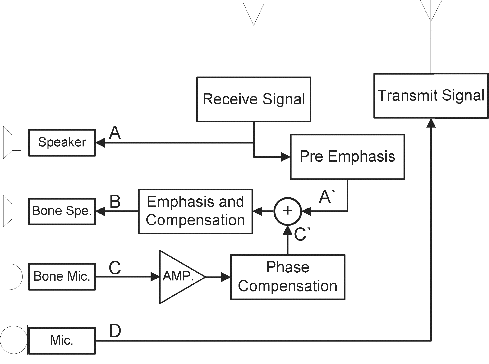
Figure 4. Components applied to the bone-conduction system.
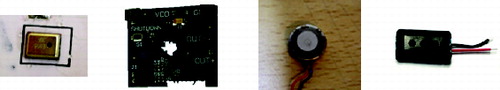
Figure 5. Open- and closed-loop frequency responses.
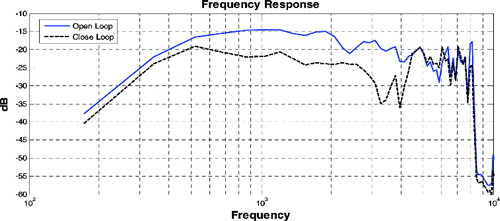
Figure 6. Parameters of frequency modelling.
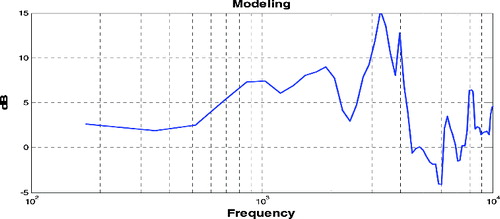
Figure 7. Comparison of frequency responses between an ordinary phone and a bone-conducting phone.
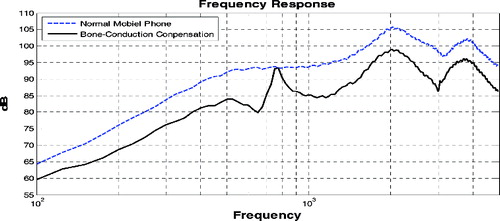
Figure 8. Comparative analysis before and after the activation of the proposed system.
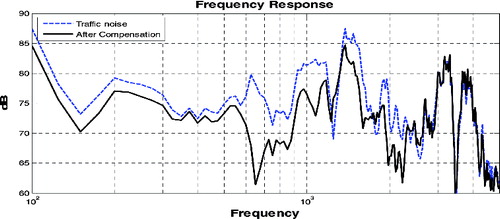
Table 2. Results from the sensitivity assessment.