Figures & data
Table 1. Tolerance to osmotic stress at seedling stage of five durum wheat genotypes in a diallel cross, averaged for three years.
Table 2. Significance of GCA and SCA and the ratio between GCA and SCA variances.
Figure 1. Dendrogram of five durum wheat genotypes based on phenotypic traits (means of three years) under water stress conditions (a) and on microsatellite markers (b).
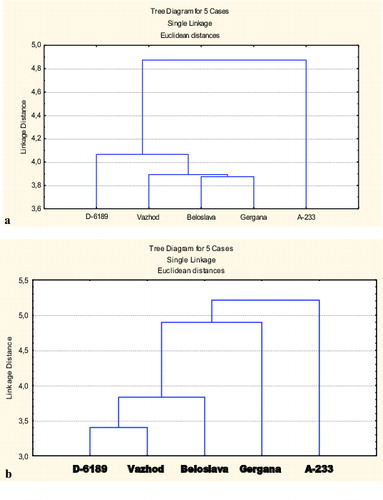
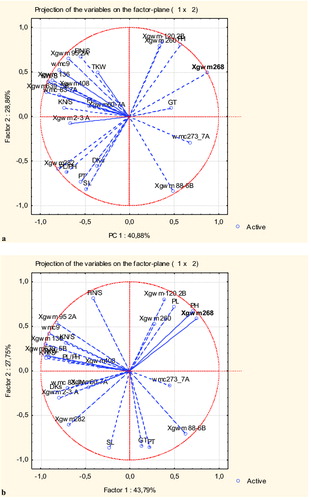
Figure 2. PCA of phenotypic traits and molecular markers in five Bulgarian durum wheat genotypes grown in a greenhouse during 2006–2009 at water-limited conditions (a) and well-watered conditions (b).