Figures & data
Figure 1. (A) Kinetics of MDCK II cells treatment with sPLA2 (1.5 × 10⁻⁶ mol L−1 and Trypan blue staining at 30 min). (B) In vitro cytotoxic effect of pure sPLA2 (0.5 to 1.5 × 10⁻⁶ mol L−1 on MDCK II cells after two hours of exposure to different snake venom sPLA2 concentrations. Cell viability is determined by MTT assay (the MTT value of control sample exposed only to PBS buffer is defined as 100% viability). Data from the experiments performed in triplicate are expressed as mean ± SD.
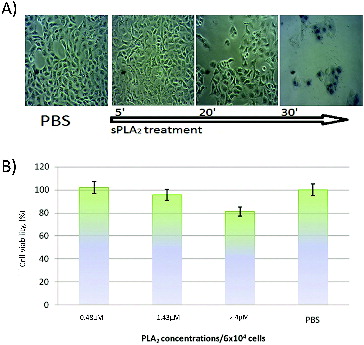
Figure 2. (A) Kinetics of Best-transfected MDCK II cells treatment with PLA2 (1.5 × 10⁻⁶ mol L−1 and Trypan blue staining at 30 min). (B) In vitro cytotoxic effect of pure sPLA2 (0.5 to 1.5 × 10⁻⁶ mol L−1 on MDCK II-Best1 cells after two hours exposure to different snake venom sPLA2 concentrations.
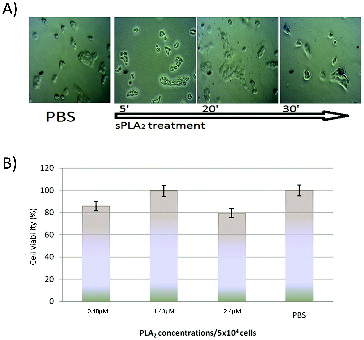
Figure 3. (A) Kinetics of A549 cells treatment with PLA2 (1.5 × 10⁻⁶ mol L− 1 and Trypan blue staining at 30 min). (B) In vitro cytotoxic effect of pure sPLA2 (0.5 to 1.5 × 10⁻⁶ mol L−1 on A549 cells after two hours of exposure to different snake venom sPLA2 concentrations.
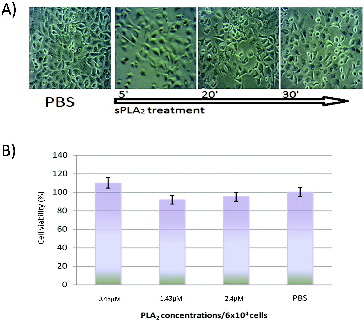
Figure 4. (A) Kinetics of RPE-1 cells treatment with PLA2 (1.5 × 10⁻⁶ mol L−1 and Trypan blue staining at 30 min). (B) In vitro cytotoxic effect of pure sPLA2 (0.5 to 1.5 × 10⁻⁶ mol L−1 on RPE-1 cells after two hours of exposure to different snake venom sPLA2 concentrations.
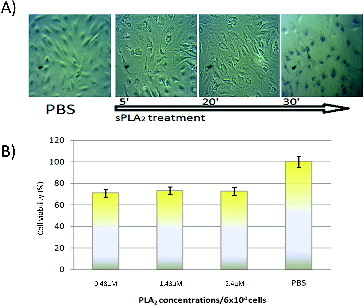
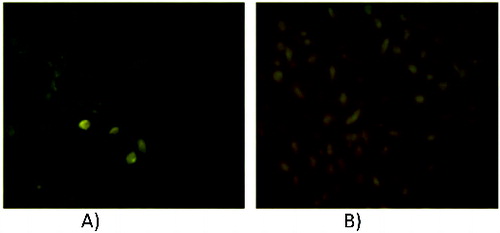
Figure 5. Fluorescence micrographs of MDCK II (A) and RPE-1 (B) cells after incubation with 1.5 × 10⁻⁶ mol L−1 ANS-labelled sPLA2.