Figures & data
Figure 1. Transepithelial resistance of Best1 transfected and non-transfected MDCK II cell lines. The first few days (first–fourth day) both cell lines showed similar values (about 110 Ω) of transmembrane resistance. On the fifth day, the non-transfected cells showed maximum value (about 140 Ω) of epithelial resistance, corresponding to the formation of monolayer. The transfected cells showed maximum value of transepithelial resistance on the ninth day of their cultivation. Each value represents the mean ± standard error of the mean (SEM) (n = 3), and P > 0.05 for fourth day and P < 0.001 for fifth day.
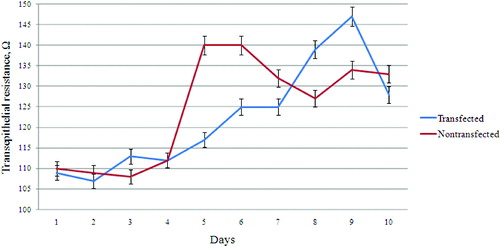
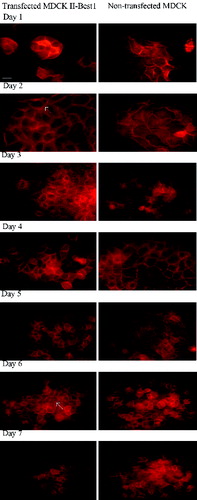
Figure 2. Rearrangement of actin cytoskeleton of Best1 transfected and non-transfected MDCK cells. Transfected and non-transfected cells were grown on cover slips for seven days and actin was stained with phalloidin conjugated with TRITC. From the first to the fifth day, transfected cells showed thicker actin cortex (marked with white arrow on the second day), compared to the non-transfected cells. Actin filaments in both cell lines look morphologically equal on sixth and seventh day. Scale bar – 10 μm.