Figures & data
Table 1. Primer sequences.
Figure 1. In vivo and in vitro observation of BMP-6 expression in follicles. BMP-6 expression was observed by immunofluorescence. In vivo expression of BMP-6 in primary follicles on day 14 (A), day 20 (B) and day 24 (C). In vivo expression of BMP-6 in the secondary follicles on day 14 (D), day 20 (E) and day 24 (F). In vitro expression of BMP-6 in granulosa cells from follicles on day 6 (G) and day 10 (H). In vitro expression of BMP-6 in the COC from follicles on day 6 (I) and day 10 (J). Bar = 100 μm.
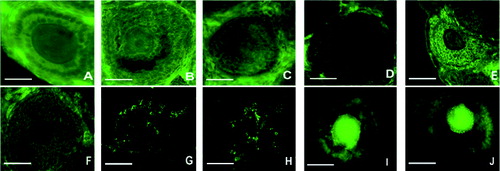
Figure 2. Expression levels of BMP-6 in ovaries in vivo and in follicles cultured in vitro. Follicles were cultured for 0, 6 and 10 days (500 each) in vitro. Representative western blot results (A); quantitative western blot results (B). β-actin was used as an internal control. *P < 0.05, compared with the control group.
Figure 3. Effect of rhBMP-6 on the morphology of preantral follicles in vitro. Follicles under normal development (A) or abnormal development (B), on day 2, 4, 6, 8, 10 and 11. Bar = 100 μm.
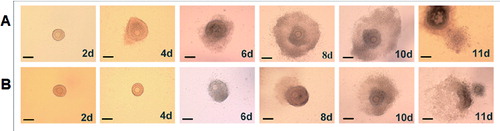
Figure 4. Effect of rhBMP-6 on the maturation rate of preantral follicles in vitro. (A) In vitro observation under inverted microscope (bar = 50 μm): GV oocyte (a), GVBD oocyte (b), M I oocyte (c), M II oocyte (d) and in vivo observation of M II oocyte (e); GV (the upper arrow in (a)), zona pellucida (the lower arrow in (a)) and first polar body (the arrows in (d) and (e)). (B) Maturation rates of follicles in different groups: control, group A (incubation with 50 ng/mL rhBMP-6 for 11 days), group B (incubation with 50 ng/mL rhBMP-6 for 8 days), group C (incubation with 100 ng/mL rhBMP-6 for 11 days) and group D (incubation with 100 ng/mL rhBMP-6 for 8 days). *P < 0.05, compared with the control group.
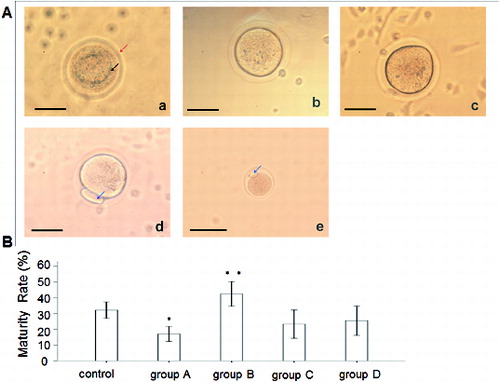
Figure 5. Morphology and distribution of chromosomes and spindle. Images were observed under confocal microscope. Chromosome and spindle in normal M II oocytes (A and B); M II oocytes whose size was the same with that of the first polar body in group D (C); cataclastic M II oocytes with normal chromosome and spindle in group A (D); cataclastic M II oocytes with the chromosomes decondensed and the spindle fibres disintegrated in group A (E and F). First polar body (white arrow); groups are described in the text to . Bar = 100 μm.
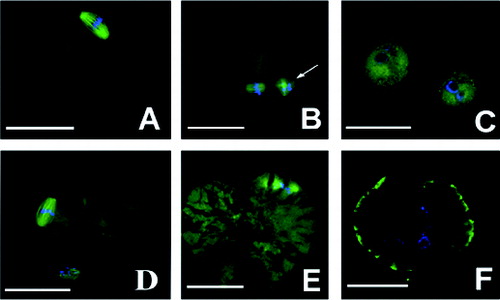
Figure 6. Expression levels of E2 in different groups in spent medium in vitro. ELISA results. Concentrations of E2 in spent medium on day 6 (A) and on day 10 and day 11 (B). Groups are described in the text to . *P < 0.05, compared with the control group.
Figure 7. Expression levels of P4 in different groups in spent medium in vitro. ELISA results. Concentrations of P4 in spent medium on day 6 (A) and on day 10 and day 11 (B). Groups are described in the text to . *P < 0.05, compared with the control group.
Figure 8. Expression of genes encoding selected regulatory enzymes involved in steroid hormone synthesis. RT-qPCR results. Expression of P450scc, stAR, 3β-HSD, 17β-HSD and cyp19a1 at the mRNA level on day 6 (A), day 10 (B) and day 11 (C). Groups are described in the text to . Data from 20 individual follicles in three independent experiments. *P < 0.05, compared with the control group.