Figures & data
Table 1. Fungal isolates used in this study.
Figure 1. Diagrams of plasmid vector used in this study. (a) 1.3 kb fragment of pFA6-kanmx4 plasmid and (b) 2.6 kb fragment of pEGFP75 plasmids. PTEF: A. gossypii TEF promoter, TTEF: A. gossypii TEF terminater, PtrpC: A. nidulans tryptophane promoter, TtrpC: A. nidulans tryptophane terminator regions.
Figure 2. 10-day-old cultures of (A) F. graminearum 4F and (B) F. culmorum (20F) isolates grown on PDA medium supplied with G418 at various concentrations as 0, 25, 50, 75 and 100 µg/ml.
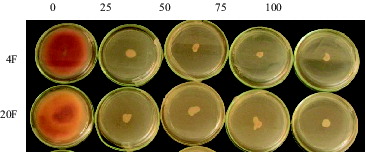
Figure 3. 20X capture of protoplasts obtained from mycelia by incubation with lytic enzyme for 6 hours. Bar indicates 50 µm length.
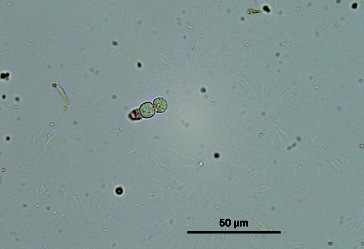
Figure 4. Fluorescence microscopy (20X capture) analysis of mycelia obtained from pEGFP75 transformed fungus.
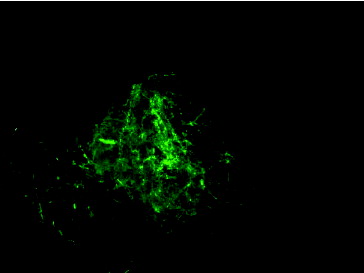
Figure 5. 720 bp DNA bands amplified from 5 pEGFP75 transformed colonies and positive control (pEGFP75 plasmid). M: 1 kb DNA ladder, N: negative control, P: positive control, E1-6: transformant samples.