Figures & data
Table 1. AD primers used in this study.
Table 2. Nested specific primers used in this study.
Table 3. Settings for TAIL-PCR.
Figure 1. Four T-DNA insertion sites were cloned by TAIL-PCR in the v1 mutant. AD1-1 and AD1-2 denote two individual DNA fragments amplified by using AD1. Brackets indicate the length of the flanking sequence.
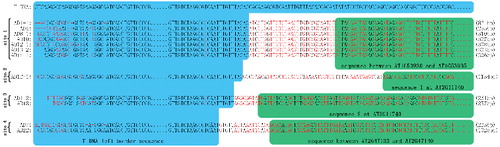
Figure 2. Flanking sequences cloned by TAIL-PCR. Arrows represent the position of the nested specific primers in the T-DNA border. Brackets show the length of flanking sequence. ×10-Lb2 represents the flanking sequences cloned by using three nested primers Lb0, Lb1 and Lb2 in the ×10 mutant. ×10-Lb3 represents the sequences cloned by using Lb1, Lb2 and Lb3 in the ×10 mutant. di2-Lb2 represents the sequences cloned by using Lb0, Lb1 and Lb2 in the di2 mutant.
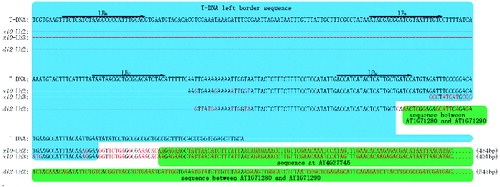
Figure 3. Head-to-head insertion mode in the v1 mutant (A). Abnormal gene structure in the dt1 mutant (B).
Figure 4. Partial deletion of two genes in the w52 mutant (A). Deletion of 39 genes in the kd361 mutant (B).