
Figures & data
Table 1. Aconitum specimens and their geographic origin.
Table 2. Primers sequences.
Table 3. Degree of polymorphism for RAPD and ISSR primers in 15 Aconitum specimens.
Figure 1. RAPD electrophoretic analysis of 15 Aconitum specimens (a: S112 primer; b: S41 primer). M: DL2000 DNA marker: 100 bp, 250 bp, 500 bp, 750 bp, 1000 bp, 2000 bp.
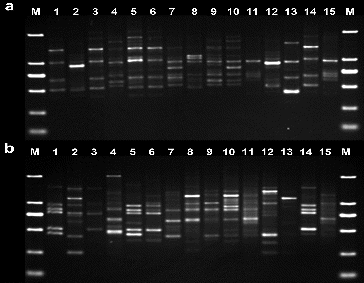
Figure 2. ISSR electrophoretic analysis of 15 Aconitum specimens (a: UBC881 primer; b: UBC823 primer). M: DL2000 DNA marker: 100 bp, 250 bp, 500 bp, 750 bp, 1000 bp, 2000 bp.
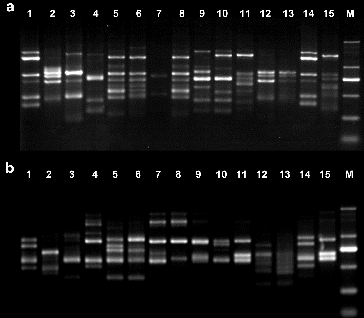
Figure 3. Dendrogram plot of 15 Aconitum specimens by UPGMA cluster analysis (RAPD).
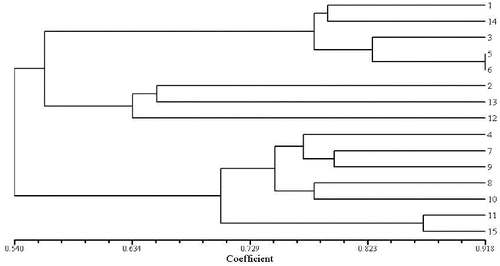
Figure 4. Dendrogram plot of 15 Aconitum specimens by UPGMA cluster analysis (ISSR).
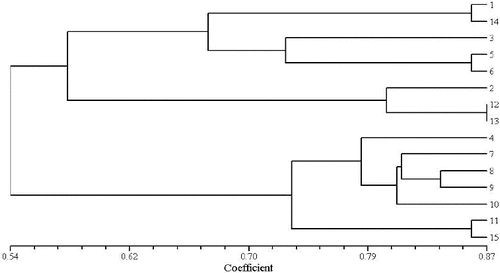
Table 4. Mean genetic data of three Aconitum specimens based on RAPD and ISSR markers.
Table 5. Genetic populations structure and estimate of gene flow within the populations of Aconitum.