
Figures & data
Table 1. Information about SSR primers used in the study. Number of amplified alleles observed against each primer pair.
Figure 1. PAGE results showing polymorphism. Lane 0: DNA molecular weight marker (50 bp DNA ladder); Lanes 1-28: polymorphic bands in sugarcane genotypes included in this study (see ).
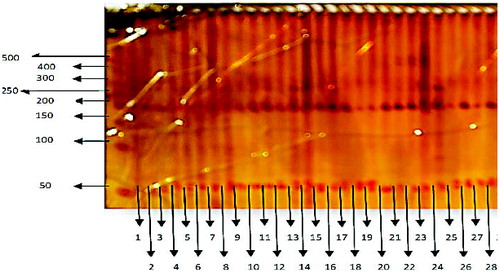
Table 2. Sugarcane (Saccharum spp.) genotypes were used in this study. In total, 28 different genotypes were employed to study SSR marker association with quantitative traits of sugarcane genotypes. Mean and LSD ranking of all sugarcane genotypes for average cane weight/plant and tillers/plant in sugarcane. Mean showing different letters will be regarded as significant at P < 0.05.
Table 3. At left, analysis of variance among 28 sugarcane genotypes for cane weight/plant depicting F value and significance at 0.01% probability. (SOV = source of variation, d.f. = degree of freedom, SS = sum of square, MS = mean squares, F. Cal = Fisher's calculated value). At right, analysis of variance of 28 sugarcane genotypes for tillers/plant. Data were found highly significant at P < 0.01.
Table 4. Marker--trait association analysed by TASSEL software.