Figures & data
Figure 1. Morphological characteristics of colony and mycelia from P. linteus strains.
Note: Fruit of P. linteus from M. alba (A), solid colony (B) and liquid mycelia (C).
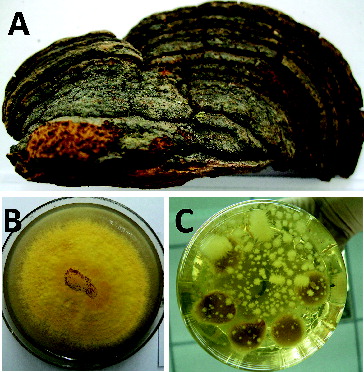
Table 1. Parameters used for development of SSR.
Table 2. Statistics of Illumina sequencing.
Table 3. Statistics of assembly quality.
Table 4. Summary statistics of functional annotation of Phellinus linteus unigenes in public databases.
Figure 2. Characteristics of sequence homology of P. linteus blasted against NCBI non-redundant (Nr) database.
Note: E-value distribution of BLAST hits for matched unigene sequences, using an E-value cutoff of 1.0 E−45 (A), similarity distribution of top BLAST hits for each unigene (B) and species distribution of the top BLAST hits (C).
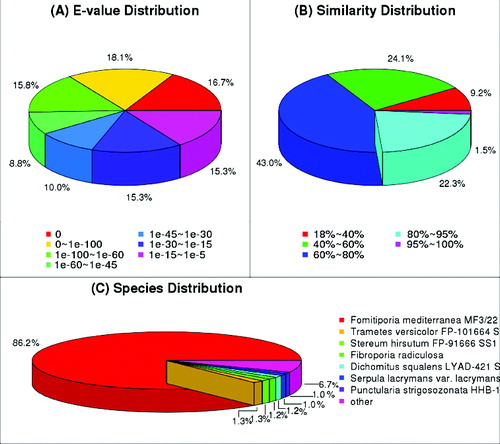
Figure 3. Histogram presentation of clusters of orthologous groups (COG) classification (unigene).
Note: All unigenes were aligned to the COG database to predict and classify possible functions. Out of 19,266 NR hits, 7831unigenes were assigned to 25 COG classifications.
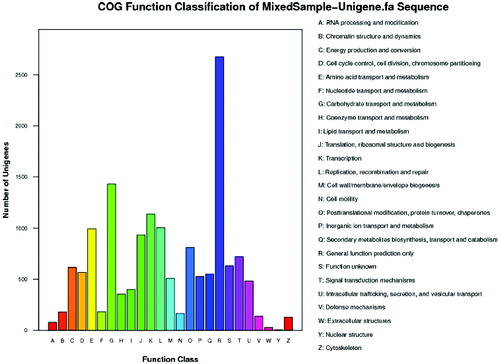
Figure 4. Gene ontology classification of assembled unigenes.
Note: The results are summarized in three main categories: biological process, cellular component and molecular function. The right y-axis indicates the number of genes in a category. The left y-axis indicates the percentage of a specific category of genes.
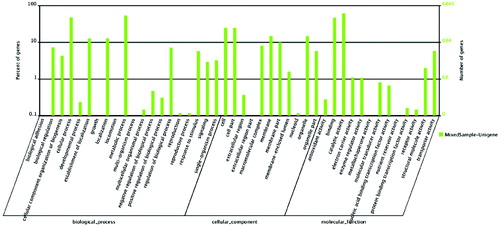
Table 5. Unigenes related to sterol biosynthesis in Phellinus linteus.
Table 6. Statistics of SSRs identified from Phellinus linteus transcriptome.
Figure 5. Simple sequence repeats: distribution of SSRs into di-, tri-, tetra-, penta- and hexarepeat types.