Figures & data
Figure 1. Two natural populations of the wild emmer wheat (T. turgidum ssp. dicoccoides) investigated in this study.
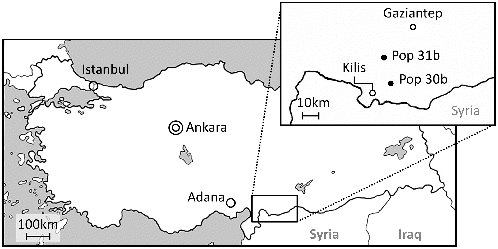
Table 1. Number of alleles and diversity indices of chloroplast microsatellite loci in the two natural populations 30b and 31b.
Table 2. Size variation of amplified fragments at 24 chloroplast microsatellite loci found among 23 plastotypes.
Table 3. Frequency of plastotypes found in population 30b and 31b.
Figure 2. UPGMA tree showing genetic relationship among 23 plastotypes identified in this study. The number in italic shows the bootstrap values for each clade, calculated by 1000 times of resampling. The code ‘Ae’ represents an Aegilops tauschii accession used as an out-group.
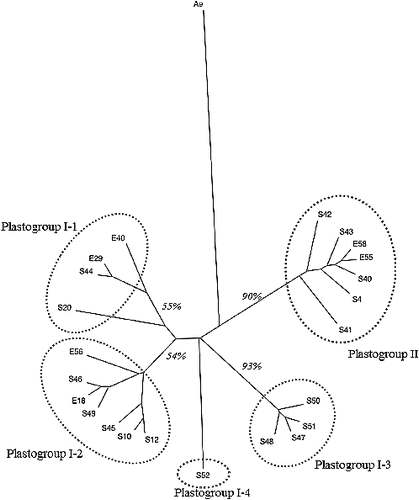
Figure 3. Two-dimensional plot of a principal coordinate analysis (PCoA) of 23 plastotypes identified in wild emmer wheat. Black circle, empty triangle and grey square represent plastotypes found in 30b, 31b and in both 30b and 31b, respectively. Axis 1 and axis 2 explained 39.3% and 25.3% of the total variation, respectively.
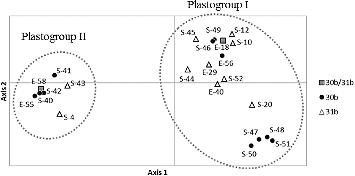
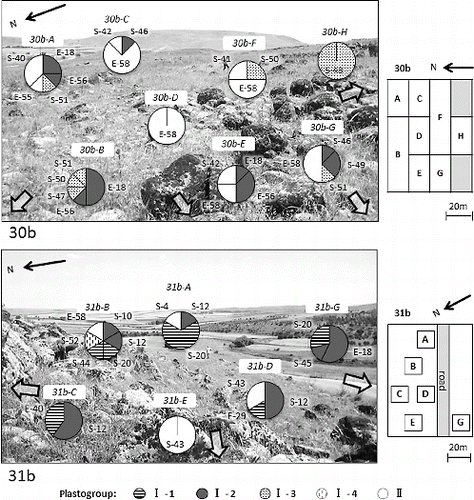
Figure 4. Frequency of plastotypes within the two populations, 30b (upper panel) and 31b (lower panel). Number in italic indicates the sampling plot in the map (right). Circles show the proportion of plastotypes found in each plot.