
Figures & data
Figure 1. Prototype of the bioreactor with multilayer plates scaffold.
Note: Perfusion tank (1), support of perfusion tank (2), silicon hose (3), buffer chamber (4), baffle (5), multilayer plate scaffold (6), circular plate (7), draft tube (8), deflector hole (9), outlet of draft tube (10), outlet pipe (11), support of plate (12).
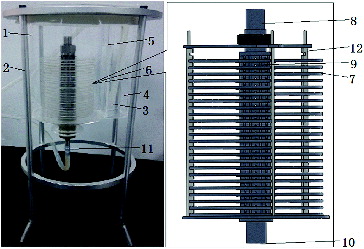
Figure 2. Cut-open view of multilayer plates configuration and computational grid.
Note: Cut-open view (a), computational grid for simulation (b). Diameter of the circular plates (D1), thickness of the circular plates (H1), height of the interstitial space between the neighbouring plates (W); inner (D2) and the outer (D3) diameter of the central draft pipe; fluid height (H2) and fluid diameter (D4).
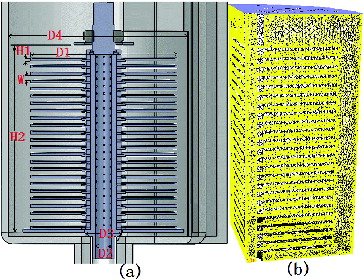
Figure 3. Distribution of fluid shear stress on every plate and flow velocity in vertical section.
Note: Distribution of FSS, the maximal value of y-coordinate is 5.00e−03 Pa (a); path-lines for flow velocity, the maximal of y-coordinate value is 9.00e−02 Pa (b).
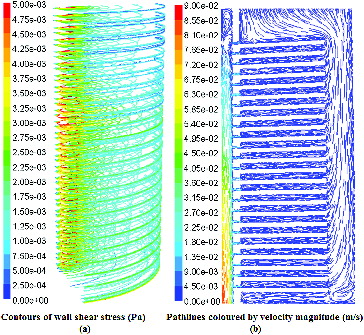
Figure 4. Distribution of FSS on 23-layer plates, with six kinds of deflector hole sizes.
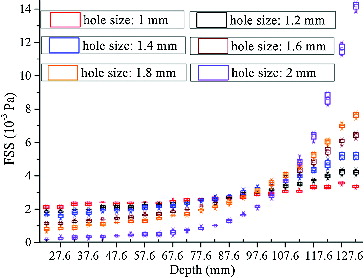
Figure 5. The distribution of FSS regression coefficients y0, A1, t1.changing with deflector hole size.
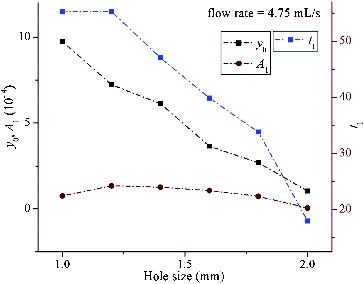
Figure 6. Fitting results of curves from .
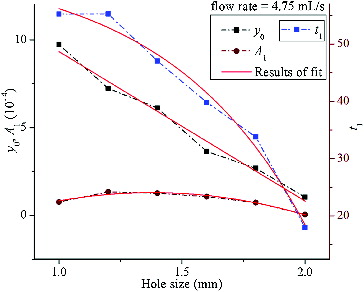
Figure 7. Diagram of adjusting the deflector hole size.
Figure 8. Distribution of deflector hole size (h) at different depth (x).
Note: Original distribution of deflector hole size (a); optimized distribution of deflector hole size (b).
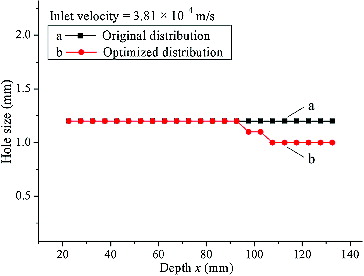
Figure 9. Distribution of FSS at different depth (x).
Note: Original distribution of FSS (a); optimized distribution of FSS (b); verified distribution of FSS (c). Fluid shear stress (FSS); computational fluid dynamics (CFD).
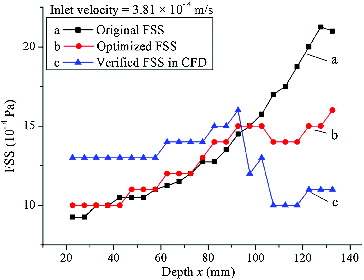
Table 1. Mean value, variance and peak-to-peak value of curves in .