Figures & data
Table 1. Distribution of the rats in the study.
Table 2. Allen's fracture of healing scoring system.
Table 3. Comparison of bone healing, inflammation, necrosis and fibrosis values of 8th day sacrification groups.
Table 4. Comparison of bone healing, inflammation, necrosis and fibrosis values of 15th day sacrification groups.
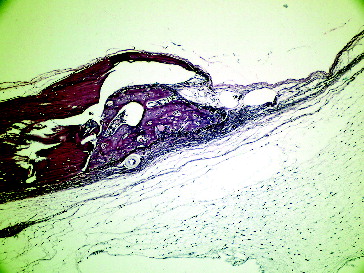
Figure 1. Seventh day grafted defect with LPT in Group I.
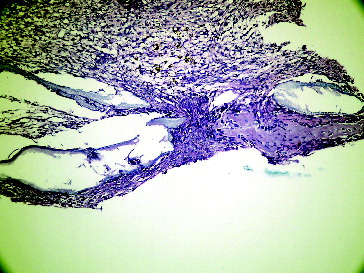
Figure 2. Seventh day empty defect with LPT in Group I.
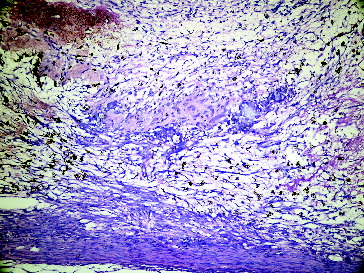
Figure 3. Seventh day grafted defect in Group II.
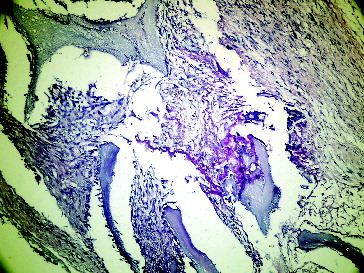
Figure 4. Seventh day empty defect in Group II.
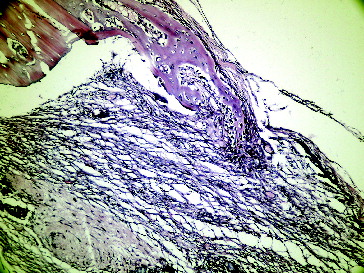
Figure 5. Fourteenth day grafted defect with LPT in Group I.
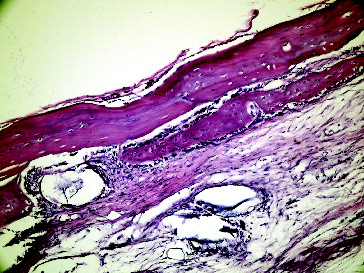
Figure 6. Fourteenth day empty defect with LPT in Group I.
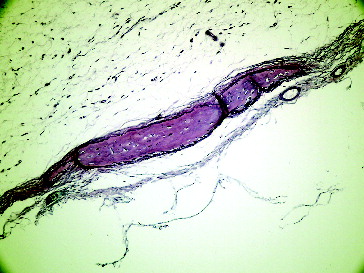
Figure 7. Fourteenth day grafted defect in Group II.
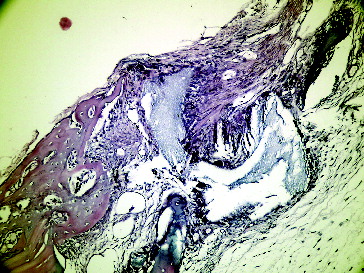
Figure 8. Fourteenth day empty defect in Group II.