Figures & data
Figure 1 . FTIR spectra of the waste S. fradiae biomass before (a) and after (b) Pb(II) biosorption.
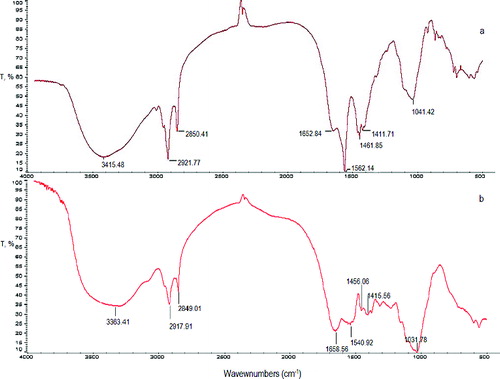
Figure 2. Effect of pH on biosorption of Pb(II) by waste S. fradiae biomass. Note: Ci = 50 mg·dm−3, V = 100 cm3, W = 1 g·dm−3, t = 120 min.
Figure 3. Effect of contact time and initial Pb(II) concentration on the NaOH-pretreated S. fradiae biomass biosorption capacity. Note: pH = 5.0, V = 100 cm3, W = 1 g·dm−3, t = 120 min, Ci = 25, 50, 100 mg·dm−3.
Figure 4. Linear plot of the Langmuir isotherm.
Figure 5. Linear plot of the Freundlich isotherm.
Table 1. Isotherm model constants and correlation coefficients for biosorption of Pb(II) ions.
Figure 6. Linear plot of pseudo-first kinetic model. Note: Ci = 25, 50, 100 mg·dm−3.
Figure 7. Linear plot of pseudo-second kinetic model. Note: Ci = 25, 50, 100 mg·dm−3.
Table 2. Kinetic constants for Pb(II) biosorption by waste S. fradiae biomass.
Figure 8. Biosorption of Pb(II) onto S. fradiae biomass. Notes: 1 – Pb(II) ions only; 2 – Pb(II) and Cu(II) ions; 3 – Pb(II) and Zn(II) ions.