
Figures & data
Table 1. Comparative analysis of CdS QDs synthesized by bacterial, fungal and plant matrices.
Figure 1. Colloidal solution containing CdS nanoparticles biosynthesized using (a) the fungal matrix and (b) control sample containing deionized water with CdSO4 and Na2S salts. Scale bar = 1 cm.
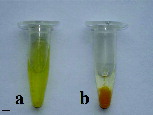
Figure 2. UV–visible absorption spectrum of CdS nanoparticles.

Figure 3. Luminescence spectrum of CdS nanoparticles. Note: Excitation λ = 340 nm.
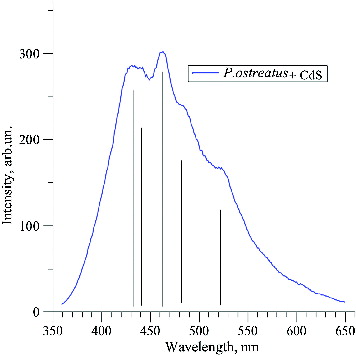
Figure 4. Photoluminescence of CdS quantum dots.Note: 400 nm excitation; clear luminescent band corresponding to 472 nm.
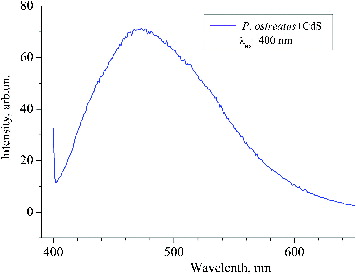
Figure 5. HRTEM micrograph of aggregates of CdS nanoparticles. Note: Scale bar = 100 nm.
Figure 6. HRTEM image of CdS nanoparticles. Note: Scale bar = 20 nm.
Figure 7. High-magnification HRTEM image of CdS nanoparticles. Note: Scale bar = 5 nm.
Figure 8. Particle size distribution histogram based on HRTEM images.
Figure 9. Electron diffraction pattern of CdS nanoparticles.
Table 2. Elemental composition of control and experimental (with nanoparticles) samples determined by electron diffraction spectroscopy.