Figures & data
Figure 1. Plasmid constructs used in this study.
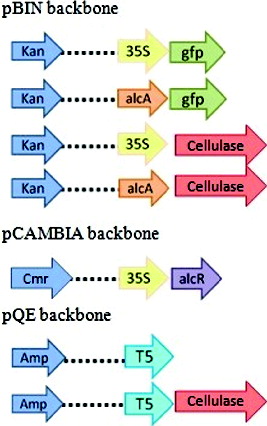
Table 1. Bacterial/plant strains, plasmids and primers used in this study.
Table 2. The magnitude of fold differences between all upregulated samples.
Figure 2. Ethanol toxicity assay for E. coli cultures.
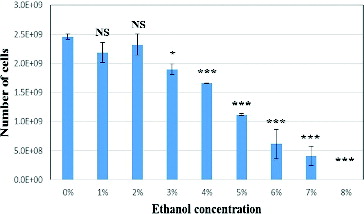
Figure 3. Analysis of RT-PCR with gel electrophoresis. Transcription of the three genes (gfp, cellulase and alcR) targeted by correlating detection primers. cDNA (0.3 µL) was used for this test. (A) Transcription of cellulase gene for various strains (1% and 2% indicate ethanol concentration added to the culture). cDNA (0.5 µL) was used for this test (B).
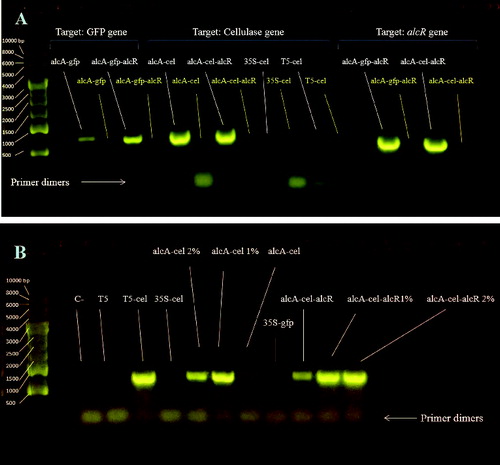
Figure 4. Expression comparison of cellulase genes between different E. coli strains. Clustergram showing all sorted samples, based on the expression intensity (red demonstrate the highest expression level and green the lowest level) (A). Expression variations between different E. coli strains (B).
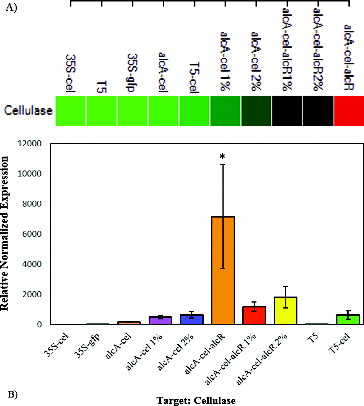
Figure 5. Expression comparison of alcR gene under different ethanol concentrations.
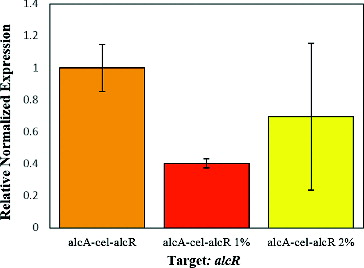
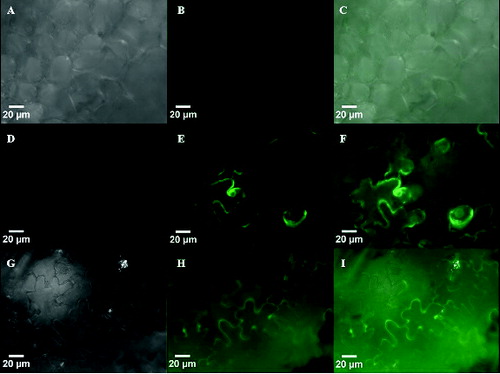
Figure 6. Epifluorescence micrographs of GFP fluorescence in tobacco leaves expressing p35S-gfp at day three (D–F) and palcA-gfp-alcR at day five (G–I). Fluorescent activity of these lines was compared to wild type leaves (A–C), which showed no fluorescence.