Figures & data
Figure 1. Location map of Kure Mountains National Park, Turkey.
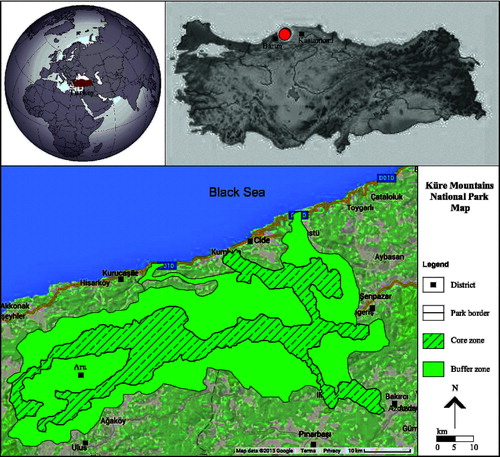
Figure 2. A hierarchical example with five criteria and three alternatives for a goal.
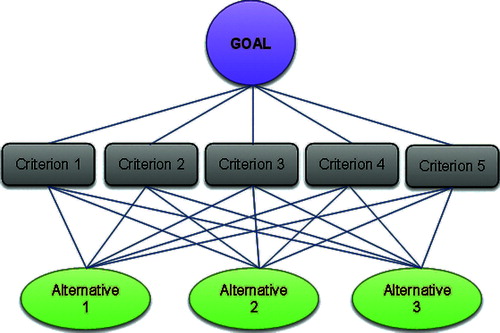
Table 1. Analytic hierarchy process scale and definitions.[Citation2,Citation26]
Figure 3. Hierarchy process created for determination of the resource values affected by the recreational and tourism activities in the Kure Mountains National Park.
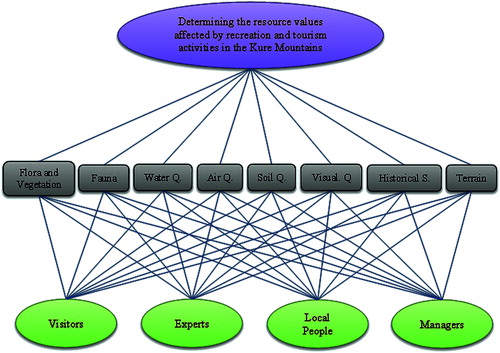
Table 2. AHP pairwise comparison matrix.
Table 3. Random consistency index values (RI values).[Citation27]
Table 4. Differences between the views of stakeholders.
Table 5. Impact of recreational and tourism activities on the resource values – visitors’ evaluations.
Table 6. Impact of recreational and tourism activities on the resource values – experts’ evaluations.
Table 7. Impact of recreational and tourism activities on the resource values – local people's evaluations.
Table 8. Impact of recreational and tourism activities on the resource values – managers’ evaluations.
Figure 4. The percent distribution (priority vector) of each stakeholder.
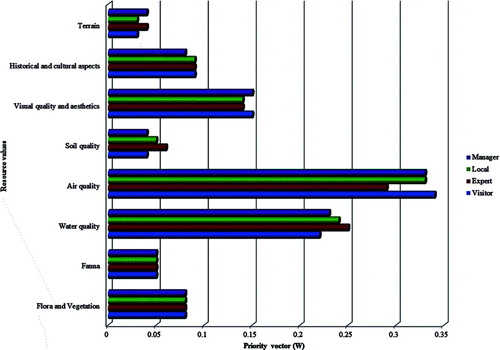
Table 9. Stakeholders’ evaluations of the recreational and tourism activities’ impacts on the resource values.
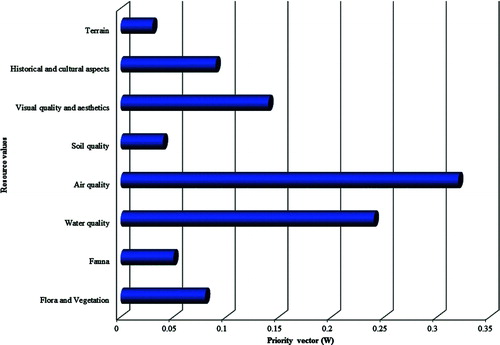
Figure 5. Stakeholders’ evaluation of the recreational and tourism activities’ impacts on the resource values.