Figures & data
Figure 1. Comparison of a part of the deduced amino acid (aa) sequence of Synechocystis PCC 6803 DnaK2 (636 aa) with those of DnaK2 proteins from Synechocystis PCC 6714 (637 aa), Staphylococcus aureus (610 aa), Saccharomyces cervisiae (657 aa), Oryza sativa Indica Group (648 aa), Arabidopsis thaliana (650 aa) and Homo sapiens (701 aa), using the single-letter code (CLUSTALW).
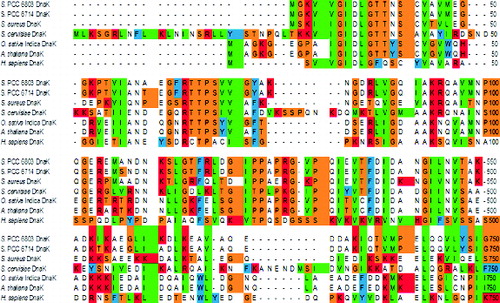
Table 1. Identity and similarity per cent of Synechocystis PCC 6803 DnaK2 protein with DnaK proteins from some prokaryotic and eukaryotic organisms (LALIGN).
Figure 2. Expression of the Sll0170 gene in E. coli. (A) Construction of the plasmid pTYB21/Sll0170. (B) PCR amplification of the Sll0170 gene from Synechocystis PCC 6803 (lane 1) and restriction map of the Sll0170 gene using XbaI (lane 2) and SmaI (lane 3), while lane M is 100 bp DNA ladder (Promega). (C) SDS-PAGE analysis of the recombinant DnaK2 expressed in E.coli cells. Lane 1, pTYB21-only transformed E. coli; lane 2, pTYB21/Sll0170-transformed E. coli; lane M, Page Ruler Prestained Protein Ladder (Life Technologies).
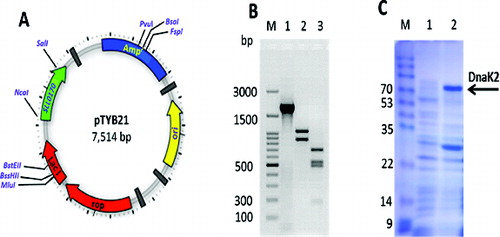
Figure 3. Growth of E. coli wild-type cells with an empty pTYB21 vector and recombinant cells with pTYB21/sll0170 in LB medium exposed to temperature shock. Growth curves are shown for two cultures. At time zero, one culture was maintained at 37 °C ((a) blue and (b) red line), while a second culture was transferred to 45 °C and then returned to 37 °C after 15 min ((c) green and (d) purple line). The culture density at time zero was OD600 = 0.4.
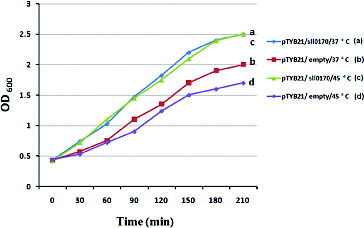
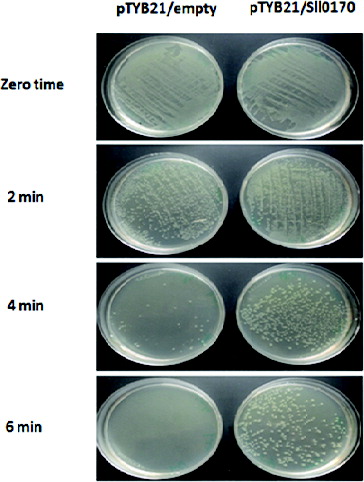
Figure 4. Effect of high-temperature stress (52 °C for 2, 4 and 6 min) on the growth of E. coli wild-type (pTYB21/empty) and recombinant (pTYB21/Sll0170) cells.