
Figures & data
Figure 1. Structure of meloxicam.
Table 1. Meloxicam and its metal complexes investigated in the present study.
Table 2. Concentrations of the compounds (meloxicam and its metal complexes) and their solvent (DMSO) tested in the study.
Figure 2. Concentration-response curves of meloxicam and its metal (Cu(II), Zn(II), Co(II), Ni(II)) complexes against human 8MGBA and HeLa cancer cells evaluated by MTT test after a 96 h treatment period.
Table 3. Cytotoxicity (CC50, µmol/L) of meloxicam and its metal complexes against 8MGBA and HeLa human cancer cell lines.
Table 4. Cytotoxicity (CC90, µmol/L) of meloxicam and its metal complexes against human 8MGBA and HeLa cancer cell lines
Figure 3. A complete monolayer of 8MGBA human glioblastoma multiforme cells with bright yellow-green nucleoli and bright yellow-green granular accumulations within the cytoplasm – culture medium control (a); 8MGBA cells 72 h following the treatment with с 500 µg/mL meloxicam (b); 500 µg/mL Cu-Meloxicam (c); 500 µg/mL Zn-meloxicam (d); 500 µg/mL Co-meloxicam (e) and 500 µg/mL Ni-Meloxicam (f). Note: Significant cell losses as well as cell shrinkage with foamy vacuolation of the cytoplasm (b). Moderate cell losses (c, d and e) as well as chromatin condensation (d, e). Acridine orange – propidium iodide staining. Bar = 50 µm.
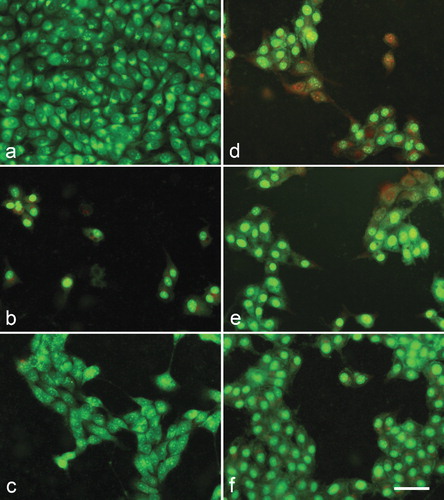
Figure 4. A complete monolayer of HeLa human cervical carcinoma cells with bright yellow-green nucleoli and bright yellow-green granular accumulations within the cytoplasm – culture medium control (a); HeLa cells 72 h following the treatment with с 500 µg/mL meloxicam (b); 500 µg/mL Cu-meloxicam (c); 500 µg/mL Zn-meloxicam (d); 500 µg/mL Co-meloxicam (e) and 500 µg/mL Ni-meloxicam (f). Note: Cell swelling with increasing of intercellular spaces (b); moderate cell losses (c), as well as appearing of dead cells (red nuclei) (c, d, e and f). Acridine orange – propidium iodide staining. Bar = 50 µm.
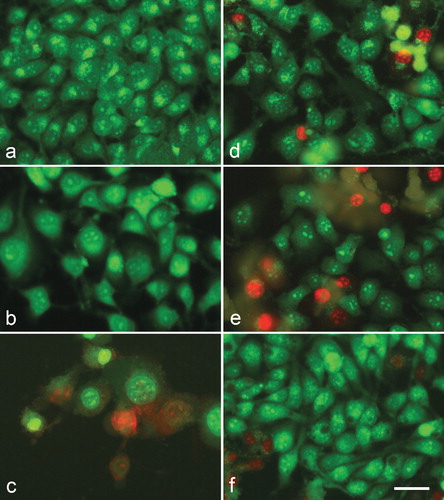
Table 5. Genotoxicity testing of meloxicam and its metal complexes by means of the method of comet assay.
Figure 5. Representative comet images obtained after treatment of HeLa cells with meloxicam and its metal complexes. Note: The compounds were applied at a concentration of 500 µg/mL. DMSO-control cells were cultured in a medium containing 2% DMSO.
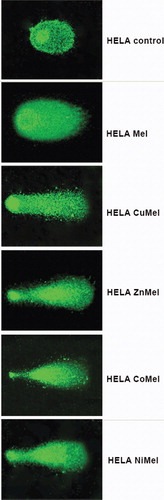
Table 6. Percentage of comets observed after treatment of HeLa cells with meloxicam and its metal complexes.
Table 7. Effect of meloxicam and its metal complexes on colony-forming ability of human HeLa cervical carcinoma cells.