
Figures & data
Table 1. The actual and coded independent variables in the Box–Behnken design for the CRL-MWCNTs catalysed synthesis of methyl oleate.
Figure 1. FTIR absorption spectra of as-synthesized MWCNTs (a), F-MWCNTs (b) and CRL-MWCNTs (c).
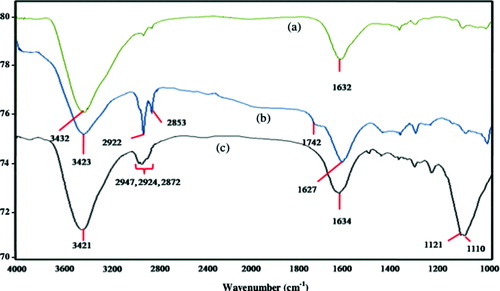
Figure 2. Thermogram of as-synthesized MWCNTs (a), F-MWCNTs (b) and CRL-MWCNTs (c).
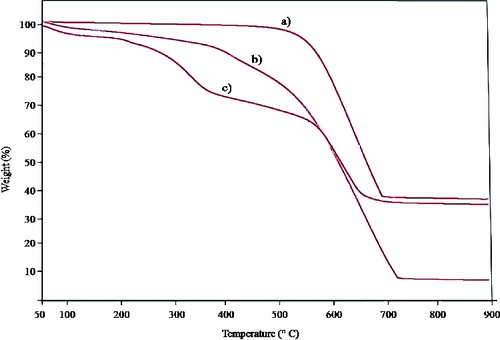
Figure 3. TEM images of as-synthesized MWCNTs (a), F-MWCNTs (b) and CRL-MWCNTs (c).
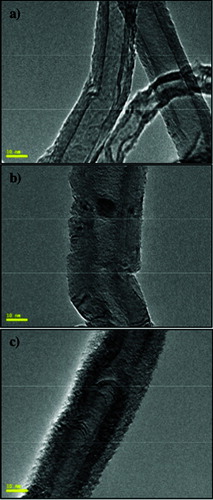
Figure 4. Results of the GC analysis for the production of methyl oleate catalysed by the CRL-MWCNTs nanobioconjugates sampled at 0 h (a) and 11 h (b).
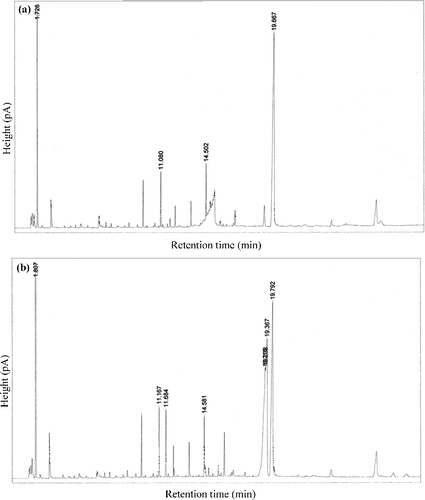
Figure 5. Esterification reaction of oleic acid and methanol catalysed by the CRL-MWCNTs.
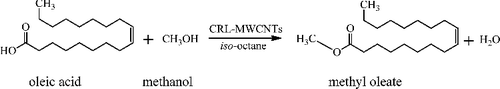
Table 2. Experimental design and results of the response surface design.
Figure 6. Comparison between the predicted and actual values for the percentage conversion in the CRL-MWCNTs catalysed synthesis of methyl oleate.
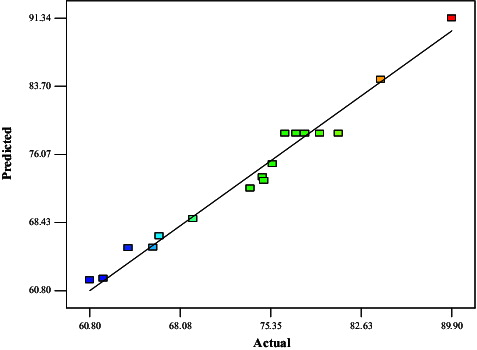
Table 3. Analysis of variance and coefficients of the model.
Figure 7. Deviation of the reference point for the percentage conversion of methyl oleate for the effect of time (A), temperature (B) and molar ratio (C).
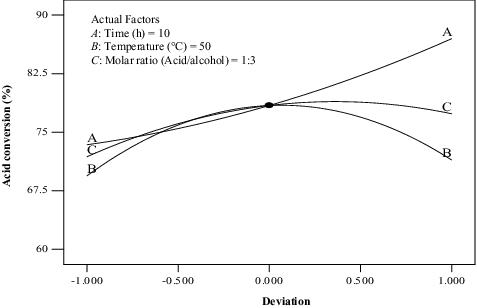
Figure 8. Graphs depicting the response surface plot (a) and contour plot (b) showing the effect of time (A) and temperature (B), and their mutual interaction in the enzymatic synthesis of methyl oleate at a constant molar ratio of 1:3 (oleic acid:methanol).
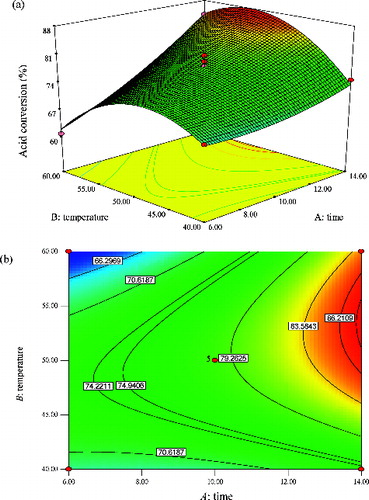
Figure 9. Graphs depicting the response surface plot (a) and contour plot (b) showing the effect of time (A) and molar ratio (C), and their mutual interaction in the enzymatic synthesis of methyl oleate at a constant temperature (50 °C).
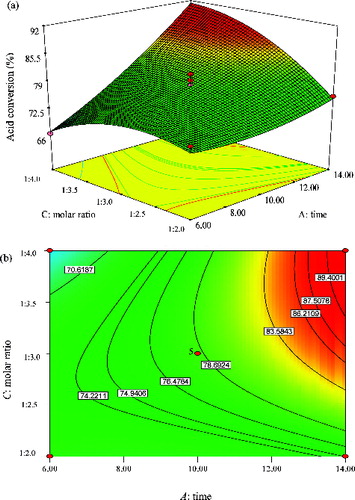
Figure 10. Graphs depicting the response surface plot (a) and contour plot (b) showing the effect of temperature (B) and molar ratio (C), and their mutual interaction in the enzymatic synthesis of methyl oleate at constant time (10 h).
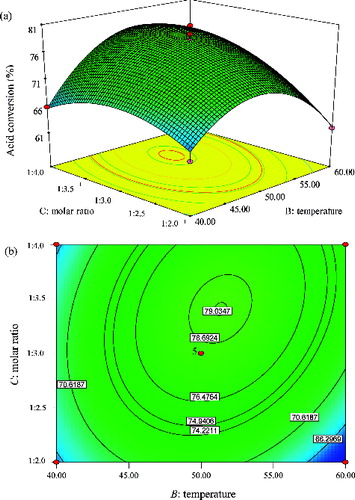
Table 4. The attained optimum conditions for the CRL-MWCNTs catalysed synthesis of methyl oleate.