Figures & data
Figure 1. Two-dimensional (a) and three-dimensional (b) diagram of the new solid-fermentation bioreactor. 1: ultraviolet (UV) light source; 2: wet conditioner; 3: air conditioner; 4: aluminum shelves; 5: air pump; 6: perforated pipes; 7: tray; 8: sterilized filter; 9: water container; 10: gauze filter: 11: gas exit; and 12: rake.
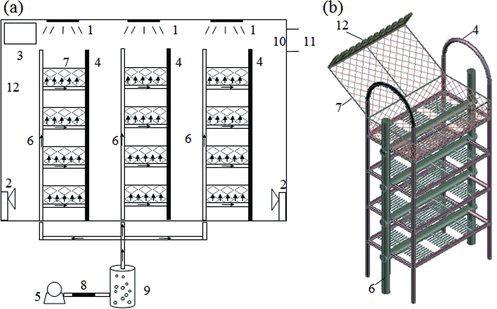
Figure 2. Kinetics of diosgenin production (a) in the new SSF reactor with different initial moisture content: 70% (left diagonal ![]()
Figure 3. Kinetics of diosgenin production (a) in the new SSF reactor at different incubation temperatures: 25 °C (left diagonal ![]()
Figure 4. Kinetics of diosgenin production (a) in the new SSF reactor with different tray depths: 1 cm (left diagonal ![]()
Figure 5. Kinetics of diosgenin production (a) in the new SSF reactor with different mixing times: once (left diagonal ![]()
Figure 6. Kinetics of biomass growth (a) and enzyme activity (b) of α-rhamnase (![]()