Figures & data
Figure 1. Effect of CEEL on the serum level of TC (A), TG (B), LDL-C (C) and HDL-C (D). Data are mean values (± SD) from 10 rabbits per group. *p < 0.05, #p < 0.01 versus the model group.
Figure 2. Effect of CEEL on expression of CRP. The data are presented as means ± SD from 10 rabbits per group. *p < 0.05 versus the model group.
Figure 3. Effect of CEEL on concentration of NO in blood. The data are presented as means ± SD from 10 rabbits per group. *p < 0.05 versus the model group.
Table 1. Effect of CEEL on the plaque area and IMT of the aortic in hyperlipidemic rabbits on high cholesterol diets.
Figure 4. Effect of CEEL on the aorta histopathological changes in rabbits fed a high cholesterol diet. Representative photomicrographs of H&E staining.
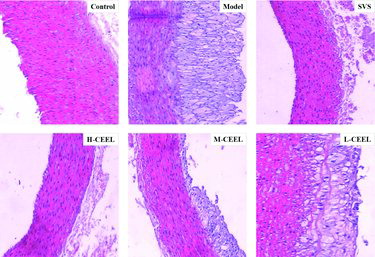
Figure 5. SDS-PAGE analysis of the VCAM-1 mRNA expression profiles in different groups of animals. M: RNA marker (units in bp), Lane 1: L-CEEL, Lane 2: M-CEEL, Lane 3: H-CEEL, Lane 4: SVS, Lane 5: model, Lane 6: control. GAPDH: internal control.