
Figures & data
Figure 1. General layout of the Vista Dent OC software showing the cephalometric analysis.
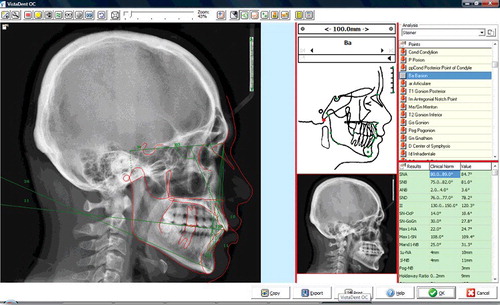
Figure 2. Image showing (a) 3D generated skull representation, and (b) generated cephalograms measurements in Maxilim software, (c) cephalometric measurements in In vivo and (d) Romexis software packages.
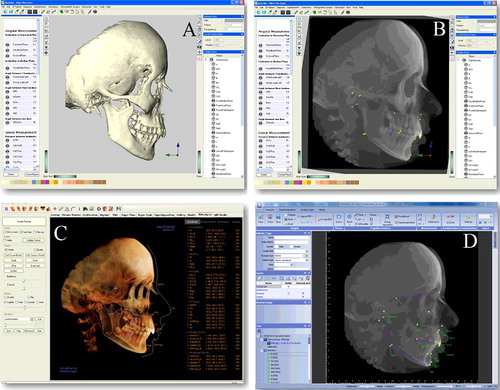
Table 1. The list of landmarks and cephalometric measurements that were used in the study.
Table 2. Intra-observer reliability for all tracing methods.
Table 3. Intra-class correlation coefficients for all tracings.
Table 4. Analysis of mean differences for 2D and 3D measurements according all tracing methods.