
Figures & data
Table 1. Taxon designation of Shiraia species from Moso bamboo seeds based on sequence data from the internal transcribed spacer regions of nuclear ribosomal DNA (ITS rDNA).
Table 2. Orthogonal design of culture medium optimization.
Figure 1. (a) Colour reaction of the pigments produced by Shiraia sp.: (1) pigment acetone extract with FeCl3 solution (1 mol/L, 0.1 mL); (2) pigment acetone extract with hydrochloric acid solution (1 mol/L, 0.1 mL); (3) pigment acetone extract with sodium hydroxide solution (1 mol/L, 0.1 mL). (b) UV–vis absorbing spectrum of the main pigment components: (1) standard hypocrellin A; (2) hypocrellins produced by Shiraia sp. 816. (c) HPLC chromatograms of authentic compound hypocrellin A: (1) standard hypocrellins (HA, hypocrellin A; HB, hypocrellin B); (2) cell extracts of Shiraria sp. 816.
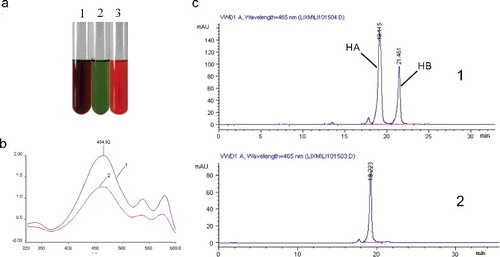
Table 3. Hypocrellin A produced by Shiraia species from Moso bamboo seeds under submerged fermentation.
Figure 2. Effects of various parameters from cultivation condition on hypocrellin A production within the single-factor experiments. DCW (♦), hypocrellin A (▪). Data are shown as mean ± SD (n = 3).
Figure 3. Effect of different carbon sources (a), organic nitrogen sources (b), inorganic nitrogen sources (c) and inorganic salts (d) on DCW (■) and hypocrellin A content (░). Data are shown as mean ± SD (n = 3). Statistical analysis of the data was performed with SSPS 18.0 using Student–Newman–Keuls test for determining significant difference (p < 0.05).
Table 4. Results of orthogonal for culture medium optimization.