
Figures & data
Table 1. List of the seven SSR-marker-generated polymorphism between the parents.
Figure 1. Experimental validation of bn1g1063 SSR marker in 20 lanes in F2 cross individuals.
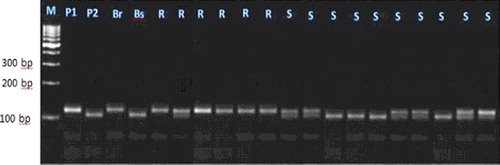
Figure 2. Experimental validation of bn1gumc2082 SSR marker in 20 lanes in F2 crosses individuals.
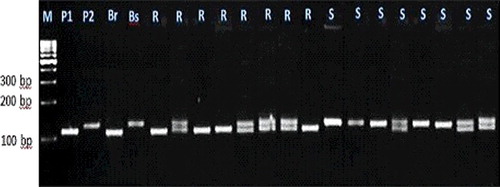
Figure 3. Experimental validation of bn1g1621 SSR marker in 20 lanes in F2 crosses individuals.
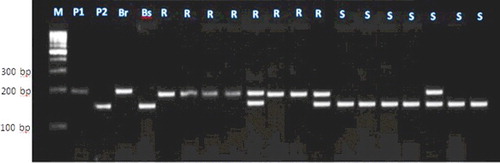
Figure 4. Experimental validation of umc2013 SSR marker in 20 lanes in F2 crosses individuals.
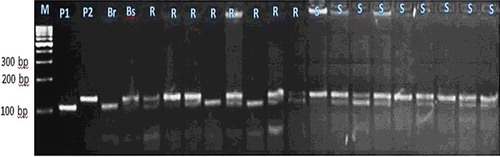
Figure 5. Experimental validation of bn1g1740 SSR marker in 20 lanes in F2 crosses individuals.
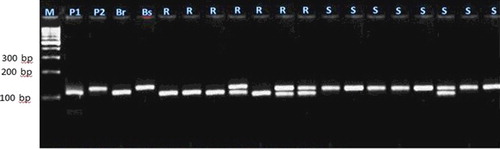
Figure 6. Experimental validation of umc2059 SSR marker in 20 lanes in F2 crosses individuals.
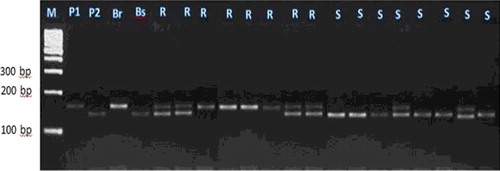
Figure 7. Experimental validation of SSR85 SSR marker in 20 lanes in F2 crosses individuals.
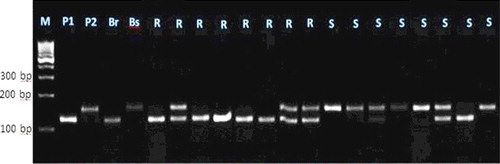
Table 2. Significant association between Fusarium ear rot resistance and markers (SSR and STS) in the 280 F2 plant population using Chi square (χ2) and simple regression (r2) analysis.
Figure 8. STS fragments produced by STS06.
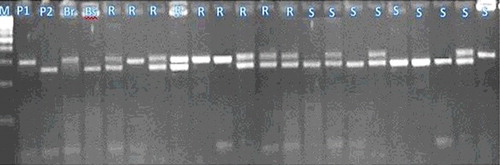
Table 3. Genetic characteristics of QTL related to Fusarium ear rot resistance genes in the 280 F2 plants population.
Figure 9. SSR markers (bnlg1063, umc2082, bnlg1621, umc2013, bnlg1740, umc2059 and SSR85), STS marker (STS06) and QTL for Fusarium ear rot resistance genes were located through the MAPMAKER QTL analysis. All distances are given in centi-Morgan, using Kosambi's mapping function.
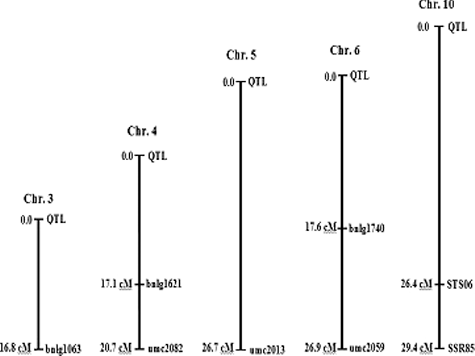
Table 4. Analysis of variance of Fusarium ear rot resistance of F2 progeny on seven SSR and STS markers.
Table 5. Genetic characteristics of QTL related to agronomic traits of the 280 F2 plants derived from NC300 × GM1002 population using SSR and STS markers.