Figures & data
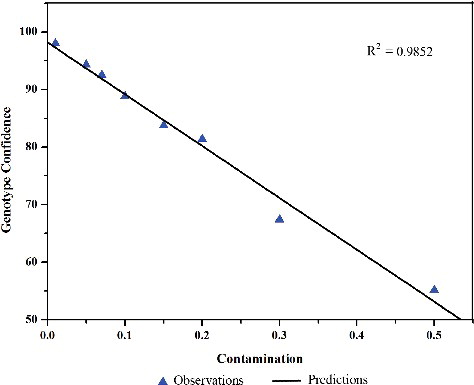
Figure 1. Morphology of P. tunicoides and S. viscidula.
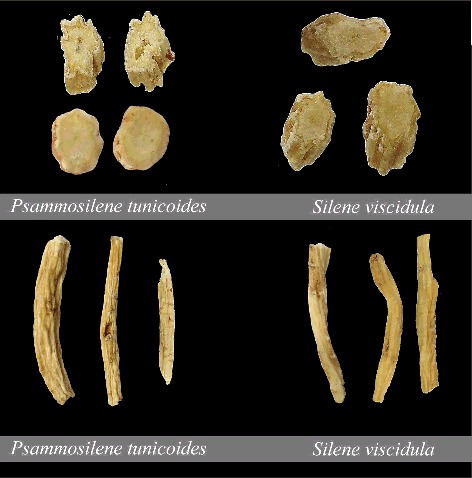
Table 1. Description of the plant materials used in this study.
Figure 2. Melting curve profiles of amplicons obtained by HRM analysis of the two species with the ITS2 type indicated. (a) Normalized plot of ITS2 primer showing the differentiation of the melting temperature (Tm) of these two species in HRM analysis. (b) Representative profiles of the melting curves (derivative melt curves) of ITS2 amplicons. (c) Difference graph of the two species, using P. tunicoides as a reference genotype.
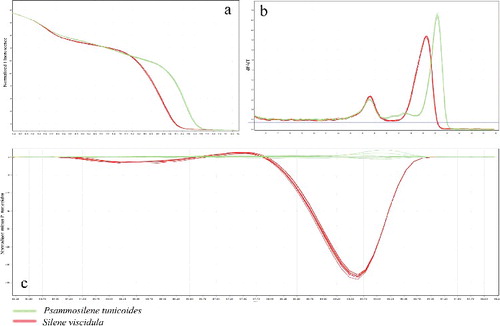
Figure 3. Phylogenetic tree of P. tunicoides and its adulterant S. viscidula constructed with the ITS2 sequences using the NJ method. The bootstrap scores (1000 replicates) are shown (≥50%) for each branch.
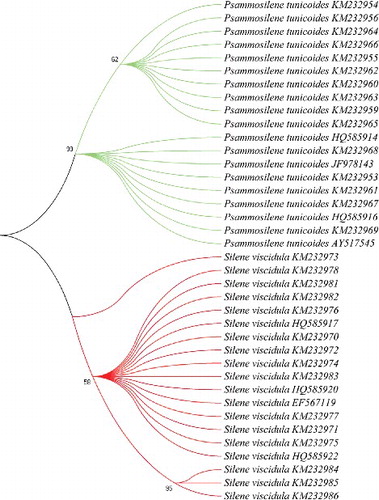
Figure 4. Adulterations of S. viscidula mixed with P. tunicoides detected by HRM analysis. (a) Normalized melting profiles obtained from different mixtures containing 50%, 30%, 20%, 15%, 10%, 7%, 5% and 1% of S. viscidula in P. tunicoides. (b) High-resolution melting curves (derivative melt curves) of the ITS2 region primer assay. (c) Reference-corrected normalized fluorescence plot of high-resolution melting using ‘P. tunicoides’ as genotype.
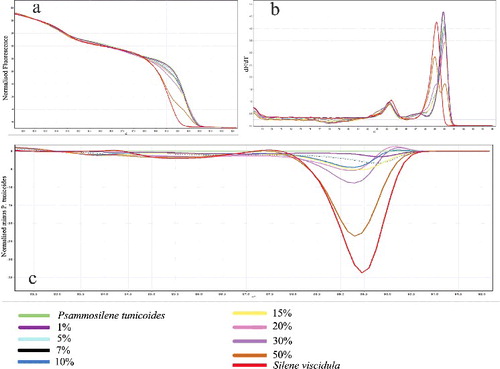
Figure 5. Pure S. viscidula was mixed with P. tunicoides in progressive proportions (1%, 5%, 7%, 10%, 15%, 20%, 30% and 50%). The results are presented as a linear regression with R2 = 0.9852.