Figures & data
Figure 1. Digital image analysis process starting from biopsy to quantification of final results.
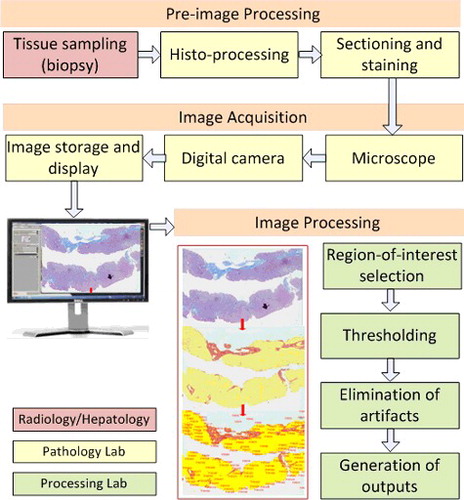
Figure 2. Typical set-up on optical microscope with digital image acquisition.
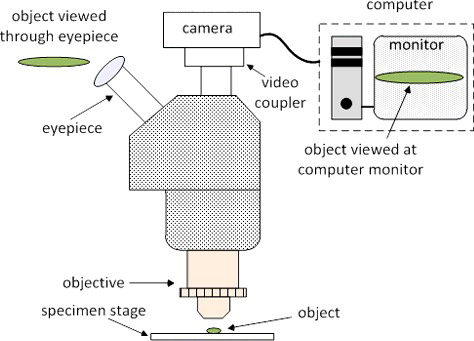
Figure 3. System parameters for magnification and resolution; Mobj, Mvc, Mmon and Mtot represent microscope magnification, video coupler magnification, PC monitor magnification and total magnification, respectively; dmon, dcam, dx,cam and dy,cam represent diagonal dimension of monitor and diagonal dimension of camera sensor, horizontal size of camera sensor and vertical size of the camera sensor, respectively; Ropt, Rdigital and λ represent optical resolution, digital resolution and wavelength, respectively; Nx, and Ny represent number of pixels in horizontal and vertical directions, respectively.
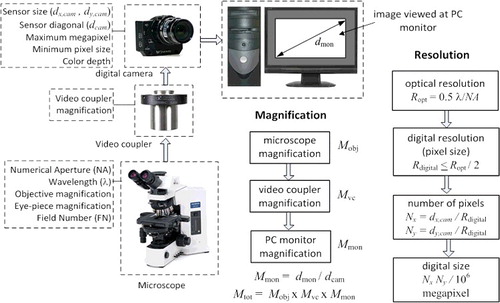
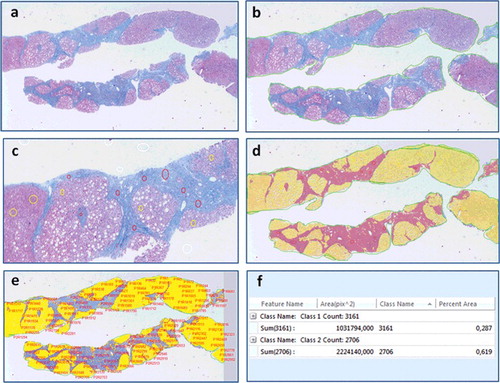
Figure 4. Digital image analysis steps performed on the image of a chronic hepatitis C patients’ biopsy interpreted as Ishak F6 by the pathologist, (a) original image, (b) region-of-interest (ROI) selection (bordering the specimen area), (c) manual thresholding (white voids within the sample represent steatosis), (d) fibrosis and parenchyma areas are converted into a binary colored overlay, (e) feature identification and extraction, (f) quantification of fibrosis and parenchyma areas, trichrome proportionate area is calculated as 0.287/(0.287 + 0.619) × 100% = 31.68%.