Figures & data
Table 1. OsHSP90 gene family and their predicted protein structure information.
Figure 1. Phylogenetic relationship of rice nine OsHSP90 members and Arabidopsis four HSP90 members. The unrooted tree was generated using MEGA4.0 program by maximum-likelihood method.
Figure 2. Real-time PCR analysis of OsHSP90 gene family members in rice Nipponbare different tissues. Ten representative tissues are as follows: Sd, three-leave seedlings; Lb, leaf blade from plants with four tillers; Ls, Leaf sheath from plants with four tillers; Stm, stem from plants with four tillers; Rt, root from plants with four tillers; at, 1.2--1.5 mmol/L anther; Pl, 5--10 cm panicle pistil; Eb, embryo 14 days after flowering; Esp, endosperm 14 days after flowering; Lbd, leaf blade 14 days after flowering. The rice β-actin gene transcript levels were used as internal controls. Error bars indicate SE based on three biological replicates.
Figure 3. Relative expression levels of OsHSP90 gene family members in rice Nipponbare under various stress and ABA conditions detected by real-time PCR. At the emergence of the fourth leaf, the seedlings of rice Nipponbare were treated with drought, high salt, cold, heat and ABA. For salt stress and drought stress, seedlings were sampled at 0, 4, 8 and 16 h, respectively. For ABA, heat and cold stress, seedlings were sampled at 0, 1, 3 and 8 h, respectively. D, drought; S, salt; C; cold; H, heat; A, ABA. The rice β-actin gene transcript levels were used as internal controls. Error bars indicate SE based on three biological replicates.
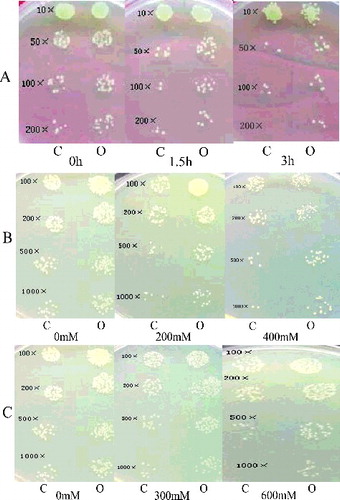
Figure 4. Growth effect of E. coli recombinants overexpressing OsHSP90-2 under different abiotic stresses. The concentrations of all induced cell cultures were adjusted to OD600 value of 1.0. The samples were diluted by 10-fold, 50-fold, 100-fold and 200-fold in heat test assay and by 100-fold, 200-fold, 500-fold and 1000-fold in mimic drought and salt test assay. Ten microliters of dilutions was spotted onto LB agar plates with 1 mmol/L IPTG. C indicated control, and here Rosetta/pET32a was used the control. O indicated Rosetta/OsHSP90-2 overexpressor. (A) At 0, 1.5 and 3 h after heat shock, respectively, (B) 200 and 400 mmol/L concentration gradient NaCl treatments, (C) 300 and 600 mmol/L concentration gradient of mannitol treatments (mimic drought). The experiment was repeated three times.