Figures & data
Table 1. Primers used in this study for identification and detection of resistance genes by PCR-based method.
Figure 1. Amplification of Tuf gene producing in Enterococcus isolates by single PCR with size of about 112 bp. First lane is 50 bp molecular weight markers.
Figure 2. Amplification of some specific genes producing in Enterococcus isolates. (a) VanC-1 and VanC-2 genes specific for E. gallinarum and E. casseliflavus on isolates E8 and E9 by single PCR with size about of 822 and 439 bp, respectively. (b) Erm(B) gene specific for erythromycin resistance on isolates E6, E8 and E10 E9 by single PCR with size about of 405 bp. (c) Tet(L) gene specific for tetracycline resistance on isolates E8 and E10 E9 by single PCR with size about of 696 bp. First lane on each panel is 100 bp molecular weight markers.
Table 2. Antimicrobial resistance profiles of 12 Enterococcus isolates.
Table 3. Polymorphism level detected by the seven repetitive sequence primers that have been used for Rep-PCR analysis.
Figure 3. Rep-PCR profile of 12 Enterococcus isolates generated with 6 repetitive sequence primers, a, b, c, e, d and f = REP1R-I, REP2-II, REP12-II, REP18-II, REP19-II and (GTG)5, respectively. First lane on each panel is 100 bp molecular weight markers.
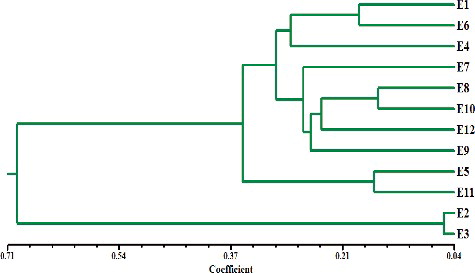
Figure 4. Dendrogram analysis among the 12 Enterococcus isolates based on the 7 repetitive sequence primers.