Figures & data
Table 1. Materials tested and their composition.
Table 2. Assessing the cell viability of 3T3 cells after culture with one and seven days of materials (AVG: average, SD: standard deviation).
Figure 1. Cytotoxic effects of Ortho MTA, Retro MTA, BioAggregate, Biodentine, MTA Plus, MTA Angelus and MTA Cerkamed upon cultured 3T3 fibroblast cells, one and seven days after. Results are shown in mean percentage from three independent experiments. The error bars represent the standard deviation (SD) (*p < 0.05).
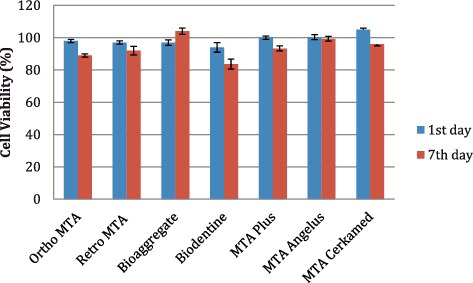
Figure 2. Effect of the Ortho MTA, Retro MTA, BioAggregate, Biodentine, MTA Plus, MTA Angelus and MTA Cerkamed on the production of MMP-2 and MMP-9 expression as determined gelatin zymogram.
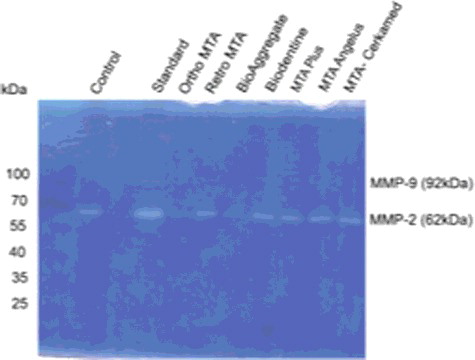
Table 3. MMP-2 levels of the conditioned medium from the 3T3 cells contact with materials (AVG: average, SD: standard deviation).
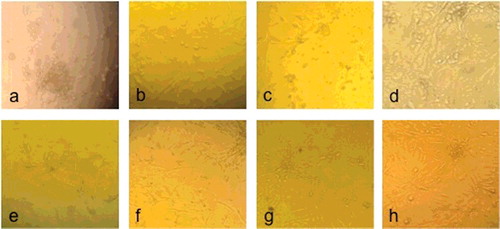
Figure 3. Microscopic pictures of 3T3 cell culture following exposure of the Ortho MTA (a), Retro MTA (b), BioAggregate (c), Biodentine (d), MTA Plus (e), MTA Angelus (f), MTA Cerkamed (g) and control group (h).