
Figures & data
Figure 1. Total flavonoids content in various solvent extracts of Ptaeroxylon obliquum leaves.
Figure 2. Estimation of total phenolic content in the various solvent extracts of Ptaeroxylon obliquum leaves.
Figure 3. Free-radical scavenging activity of different solvent extracts from Ptaeroxylon obliquum leaves, using the DPPH bioassay method.
Table 1. Minimum inhibitory concentration of different solvent extracts from Ptaeroxylon obliquum leaves or ciprofloxacin against bacterial strains associated with wound infections.
Table 2. Minimum inhibitory concentration (µg/mL) of ciprofloxacin in the presence or absence of Ptaeroxylon obliquum leaf extracts at sub-inhibitory concentration (SIC).
Figure 4. In vitro time–kill effect of extract–ciprofloxacin combinations at sub-inhibitory concentration against bacterial isolates.
Figure 5. GC–MS chromatogram of the most active antioxidant extract of Ptaeroxylon obliquum leaves (POM).
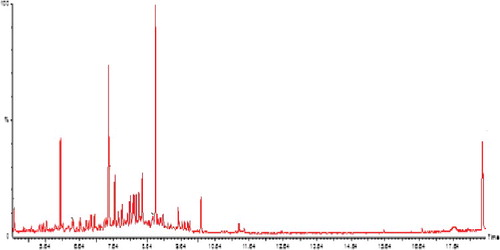
Table 3. Identified major components of the methanol extract from Ptaeroxylon obliquum leaves in the order of retention time by GC–MS and their structure.