Figures & data
Table 1. Experimental groups of mice used in this study.
Table 2. Primers used for qPCR.
Figure 1. CD44 (A and B) and VCAM-1 (C and D) immunoexpression in ASCs one day after isolation (A, C and E) and one day after passage 3 (P03) (B, D and F). Negative controls (E and F).
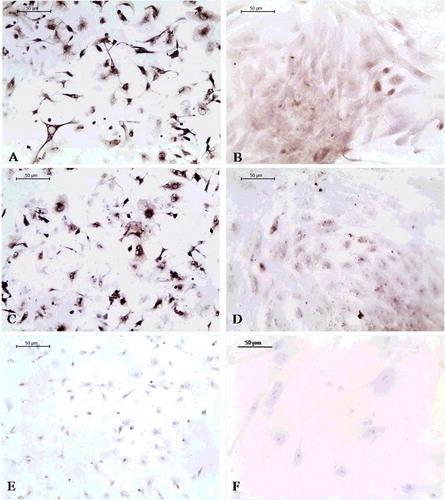
Figure 2. VCAM-1 immunoexpression in ASCs induced into ECs 7 (A), 12 (B) and 15 days (C) after P03 and in non-induced ASCs: 7 (D), 12 (E) and 15 days (F) after P03. Negative controls: 7 (G), 12 (H) and 15 (I) days after ASCs induction.
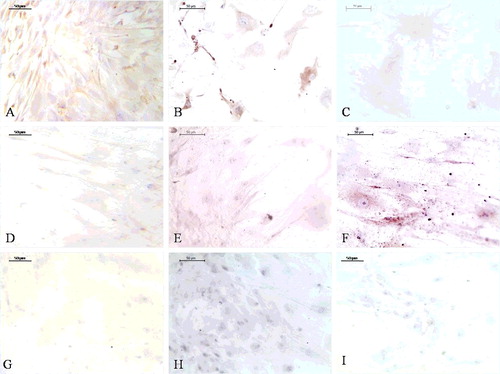
Figure 3. Egr-1 (A) and Flt-1 (B) relative expression in EPB, PB and B implants at 1-, 2-, 4- and 8-week (w) time points.
Figure 4. Vcam-1 (A) and Vwf (B) relative expression in EPB, PB and B implants at 1-, 2-, 4- and 8-week (w) time points.
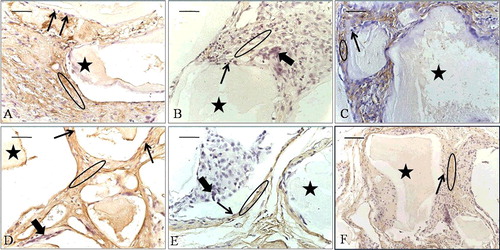
Figure 5. VCAM-1 immunoexpression (ellipse) at the 2-week time point (A–C) and at the 8-week time point (D–F). EPB (A and D), PB (B and E) and B (C and F) implants. Bio-Oss (star); blood vessels (arrowhead).
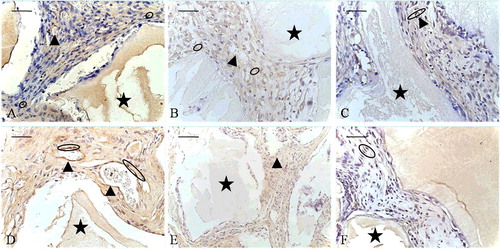
Figure 6. Negative controls for immunohistochemistry: at the 2-week time point (A–C) and the 8-week time point (D–F). EPB (A and D), PB (B and E) and B (C and F) implants.
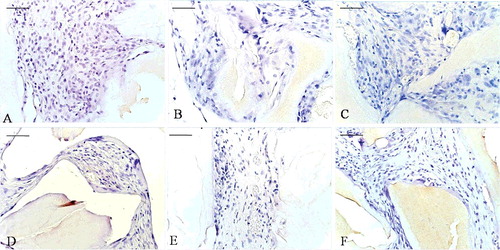
Figure 7. Toluidine blue staining: at the 2-week time point (A–C) and at the 8-week time point (D–F). EPB (A and D), PB (B and E) and B implants (C and F). Bio-Oss (star), osteoblast-like cells (long, thin arrow), multinucleated giant cells (short, thick arrow), osteoid-like tissue (ellipse).
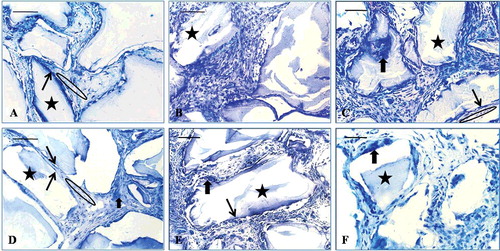
Figure 8. Relative expression of Spp1 in EPB, PB and B implants at 1-, 2-, 4- and 8-week (w) time points.
Figure 9. Osteopontin immunoexpression (ellipse) at the 2-week time point (A–C) and at the 8-week time point (D–F). EPB (A and D), PB (B and E) and B implants (C and F). Bio-Oss (star), osteoblast-like cells (long, thin arrow), multinucleated giant cells (short, thick arrow).