Figures & data
Table 1. Polymorphic bands of each RAPD primers and percentage of polymorphism in parent's strains and their corresponding fusants.
Figure 1. RAPD-PCR profile of two parent's strains (P1 and P2) (T. harzianum NBAII Th 1 and T. viride NBAII Tv 23) and their 21 corresponding fusants (lane 1 to lane 21). M: is 100 bp DNA ladder.
Figure 2. RAPD-PCR profile of two parent's strains (P1 and P2) (T. harzianum NBAII Th 1 and T. viride NBAII Tv 23) and their 21 corresponding fusants (lane 1 to lane 21). M: is 100 bp DNA ladder.
Figure 3. ISSR-PCR profile of two parent's strains (P1 and P2) (T. harzianum NBAII Th 1 and T. viride NBAII Tv 23) and their 21 corresponding fusants (lane 1 to lane 21). M: is 100 bp DNA ladder.
Figure 4. ISSR-PCR profile of two parent's strains (P1 and P2) (T. harzianum NBAII Th 1 and T. viride NBAII Tv 23) and their 21 corresponding fusants (lane 1 to lane 21). M: is 100 bp DNA ladder.

Table 2. Polymorphic bands of each ISSR primers and percentage of polymorphism in parent's strains and their corresponding fusants.
Table 3. Polymorphic bands of each ITS primers and percentage of polymorphism in parent's strains and their corresponding fusants.
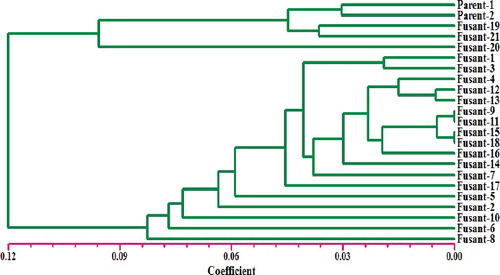
Figure 5. Dendrogram analysis among the two parent's strains (P1 and P2) (T. harzianum NBAII Th 1 and T. viride NBAII Tv 23) and their 21 corresponding fusants (fusant-1 to fusant-21) based on RAPD primers that have been used for fingerprinting.
Figure 6. Dendrogram analysis among the two parent's strains (P1 and P2) (T. harzianum NBAII Th 1 and T. viride NBAII Tv 23) and their 21 corresponding fusants (fusant-1 to fusant-21) based on ISSR and ITS primers that have been used for fingerprinting.
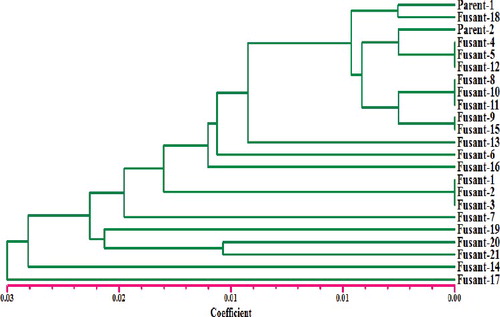
Figure 7. ITS-PCR profile of two parent's strains (P1 and P2) (T. harzianum NBAII Th 1 and T. viride NBAII Tv 23) and their 21 corresponding fusants (lane 1 to lane 21). M: is 100 bp DNA ladder.