
Figures & data
Table 1. Effect of hydrocarbons on cell growth, cell surface hydrophobicity, emulsification activity and surface tension after two weeks of incubation at 30 °C.
Figure 1. Morphological characteristics of Aspergillus oryzae (Y2). Fungal isolate from Yanbu soil on nutrient agar plate (a); SEM image of isolate Y2 at 100× magnification (b), 750× magnification (c) and 1000× magnification (d).
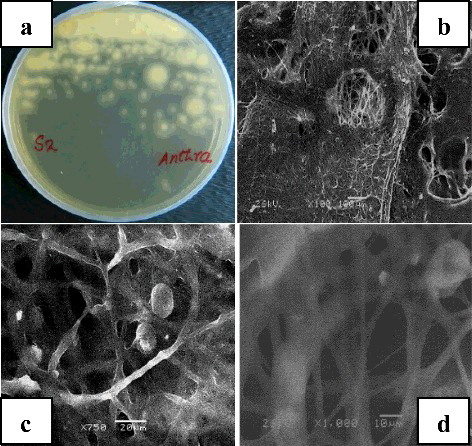
Figure 2. Comparative phylogenetic analysis of the Aspergillus niger (KR137638), Aspergillus oryzae (KR029081) and Penicillium commune (KR137639) [12].
![Figure 2. Comparative phylogenetic analysis of the Aspergillus niger (KR137638), Aspergillus oryzae (KR029081) and Penicillium commune (KR137639) [12].](/cms/asset/5c705afc-605c-49db-a64a-24848606bd4d/tbeq_a_1249407_f0002_oc.jpg)
Figure 3. Bioremediation of crude oil after two weeks of incubation at 30 °C, analysed by GC-MS. (a) without micro-organism (control) and (b) degraded sample using Y2.
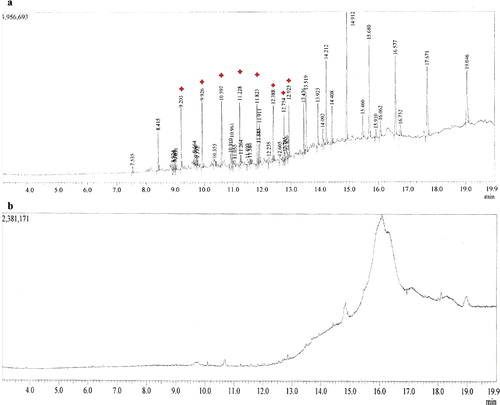
Table 2. Quantitative assessment of crude oil content in the presence of Aspergillus oryzae Y2 along with control.